G
Seller's Agent in 2021
Gretchen Haga
EXP Realty
(360) 202-6028
70 in this area
144 Total Sales
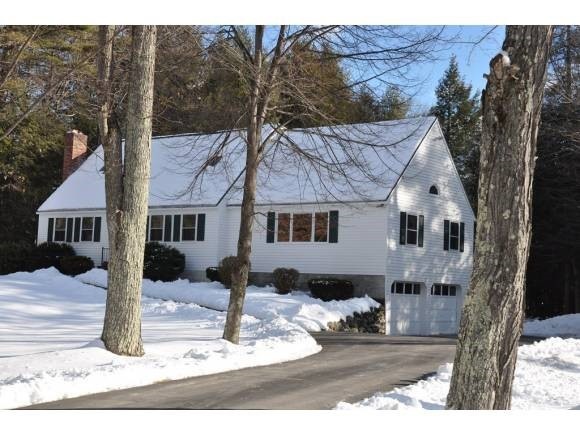
Move in ready 3-4 bedroom Cape on a beautiful level lot in a sought after neighborhood. Wood burning fireplace in Living Rm. New carpets in Living Rm, Office and stairs. Hardwood in Family Room and Dining Room. Open kitchen concept. First floor bedroom or office with closet. New 40 yr shingled roof, New boiler and new exterior paint. Interior fresh neutral paint. New kitchen appliances (Frig and Dishwasher). Seller is ready for quick close. Generator ready, washer/dryer included.
Last Agent to Sell the Property
Coldwell Banker Dinsmore Associates License #065576 Listed on: 01/05/2013

| Date | Type | Sale Price | Title Company |
|---|---|---|---|
| Warranty Deed | $570,000 | None Available | |
| Warranty Deed | $570,000 | None Available | |
| Warranty Deed | $415,000 | -- | |
| Warranty Deed | $415,000 | -- | |
| Warranty Deed | $289,900 | -- | |
| Warranty Deed | $289,900 | -- |
| Date | Status | Loan Amount | Loan Type |
|---|---|---|---|
| Open | $490,200 | Purchase Money Mortgage | |
| Closed | $490,200 | Purchase Money Mortgage | |
| Previous Owner | $394,250 | Purchase Money Mortgage | |
| Previous Owner | $25,000 | Unknown | |
| Previous Owner | $239,000 | Unknown | |
| Previous Owner | $33,400 | Unknown |
| Date | Event | Price | Change | Sq Ft Price |
|---|---|---|---|---|
| 09/03/2021 09/03/21 | Sold | $570,000 | -3.4% | $279 / Sq Ft |
| 07/23/2021 07/23/21 | Pending | -- | -- | -- |
| 07/16/2021 07/16/21 | For Sale | $589,900 | 0.0% | $289 / Sq Ft |
| 07/16/2021 07/16/21 | Price Changed | $589,900 | -1.7% | $289 / Sq Ft |
| 07/12/2021 07/12/21 | Pending | -- | -- | -- |
| 07/08/2021 07/08/21 | For Sale | $600,000 | +44.6% | $294 / Sq Ft |
| 02/23/2018 02/23/18 | Sold | $415,000 | 0.0% | $204 / Sq Ft |
| 01/08/2018 01/08/18 | Price Changed | $415,000 | -2.4% | $204 / Sq Ft |
| 12/27/2017 12/27/17 | For Sale | $425,000 | +46.6% | $209 / Sq Ft |
| 02/14/2013 02/14/13 | Sold | $289,900 | 0.0% | $142 / Sq Ft |
| 01/08/2013 01/08/13 | Pending | -- | -- | -- |
| 01/05/2013 01/05/13 | For Sale | $289,900 | -- | $142 / Sq Ft |
| Year | Tax Paid | Tax Assessment Tax Assessment Total Assessment is a certain percentage of the fair market value that is determined by local assessors to be the total taxable value of land and additions on the property. | Land | Improvement |
|---|---|---|---|---|
| 2024 | $8,784 | $388,000 | $175,100 | $212,900 |
| 2023 | $8,303 | $388,000 | $175,100 | $212,900 |
| 2022 | $7,667 | $388,000 | $175,100 | $212,900 |
| 2021 | $7,236 | $388,600 | $175,100 | $213,500 |
| 2020 | $7,434 | $388,600 | $175,100 | $213,500 |
| 2019 | $7,142 | $316,700 | $160,000 | $156,700 |
| 2018 | $7,164 | $307,600 | $160,000 | $147,600 |
| 2017 | $6,214 | $307,600 | $160,000 | $147,600 |
| 2016 | $6,683 | $306,300 | $160,000 | $146,300 |
| 2015 | $6,653 | $306,300 | $160,000 | $146,300 |
| 2014 | $7,529 | $313,700 | $180,000 | $133,700 |
| 2013 | $7,160 | $303,400 | $180,000 | $123,400 |
G
Seller's Agent in 2021
Gretchen Haga
EXP Realty
(360) 202-6028
70 in this area
144 Total Sales
Buyer's Agent in 2021
Tom O'Shaughnessy
Jill & Co. Realty Group - Real Broker NH, LLC
(978) 807-6456
1 in this area
16 Total Sales
Seller's Agent in 2018
Jaime Devine
Sue Padden Real Estate LLC
(603) 289-1695
3 in this area
116 Total Sales
Buyer's Agent in 2018
Martha Daniels Holland
RE/MAX
(603) 860-4936
2 in this area
86 Total Sales
B
Seller's Agent in 2013
Bob Peate
Coldwell Banker Dinsmore Associates
(603) 505-6880
4 in this area
15 Total Sales
Buyer's Agent in 2013
Francine Carney
(603) 548-8554
4 in this area
45 Total Sales
Source: PrimeMLS
MLS Number: 4209159
APN: WNDM-000005-A000000-000421
Disclaimer: Certain information contained herein is derived from information provided by parties other than Homes.com. All information provided is deemed reliable, but is not guaranteed to be accurate and should be independently verified.
![]() Copyright 2025 PrimeMLS, Inc. All rights reserved. This information is deemed reliable, but not guaranteed. The data relating to real estate displayed on this display comes in part from the IDX Program of PrimeMLS. The information being provided is for consumers’ personal, non-commercial use and may not be used for any purpose other than to identify prospective properties consumers may be interested in purchasing.
Copyright 2025 PrimeMLS, Inc. All rights reserved. This information is deemed reliable, but not guaranteed. The data relating to real estate displayed on this display comes in part from the IDX Program of PrimeMLS. The information being provided is for consumers’ personal, non-commercial use and may not be used for any purpose other than to identify prospective properties consumers may be interested in purchasing.