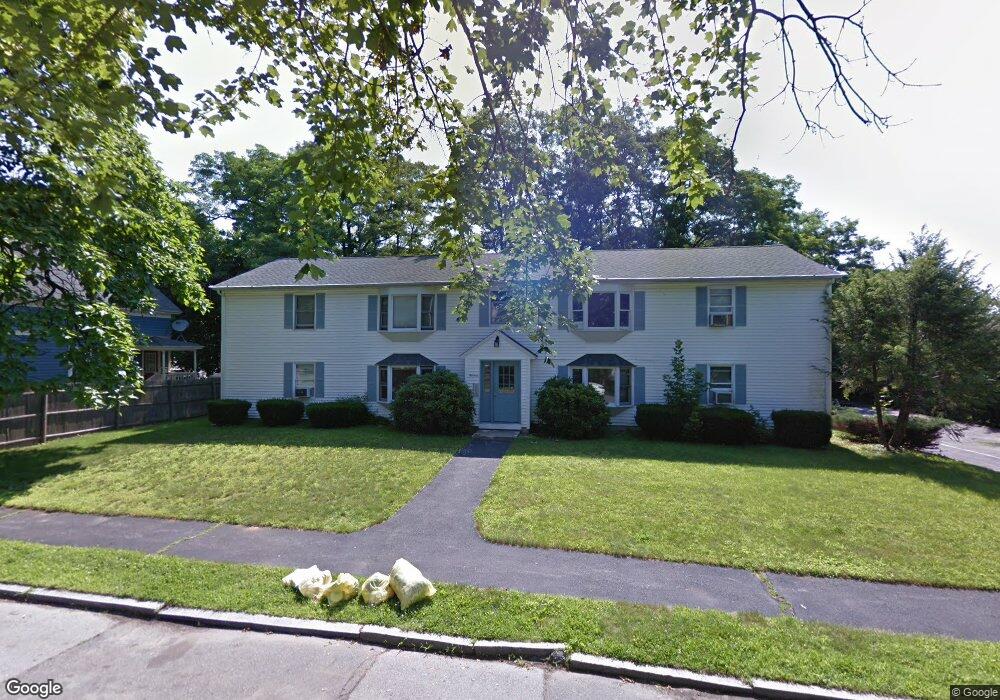
13 Vineyard St Unit 4 Worcester, MA 01603
Columbus Park NeighborhoodEstimated Value: $224,000 - $264,000
2
Beds
1
Bath
923
Sq Ft
$270/Sq Ft
Est. Value
About This Home
This home is located at 13 Vineyard St Unit 4, Worcester, MA 01603 and is currently estimated at $249,602, approximately $270 per square foot. 13 Vineyard St Unit 4 is a home located in Worcester County with nearby schools including Columbus Park Preparatory Academy, Chandler Magnet, and Jacob Hiatt Magnet School.
Ownership History
Date
Name
Owned For
Owner Type
Purchase Details
Closed on
Aug 8, 2005
Sold by
Mbugua Paul and Mburu Rachel Wanjiru
Bought by
Kangethe Patrick
Current Estimated Value
Home Financials for this Owner
Home Financials are based on the most recent Mortgage that was taken out on this home.
Original Mortgage
$100,000
Outstanding Balance
$51,768
Interest Rate
5.63%
Mortgage Type
Purchase Money Mortgage
Estimated Equity
$197,834
Purchase Details
Closed on
Oct 26, 2000
Sold by
Yalian Karen A
Bought by
Wanjiru-Mburu Rachel
Purchase Details
Closed on
Sep 30, 1997
Sold by
Celona Jennie M
Bought by
Yalian Karen A
Home Financials for this Owner
Home Financials are based on the most recent Mortgage that was taken out on this home.
Original Mortgage
$44,650
Interest Rate
7.47%
Mortgage Type
Purchase Money Mortgage
Purchase Details
Closed on
Feb 19, 1987
Sold by
Laraia Carol E
Bought by
Celona Jennie M
Create a Home Valuation Report for This Property
The Home Valuation Report is an in-depth analysis detailing your home's value as well as a comparison with similar homes in the area
Home Values in the Area
Average Home Value in this Area
Purchase History
| Date | Buyer | Sale Price | Title Company |
|---|---|---|---|
| Kangethe Patrick | $121,000 | -- | |
| Kangethe Patrick | $121,000 | -- | |
| Wanjiru-Mburu Rachel | $66,000 | -- | |
| Yalian Karen A | $47,000 | -- | |
| Yalian Karen A | $47,000 | -- | |
| Celona Jennie M | $71,250 | -- |
Source: Public Records
Mortgage History
| Date | Status | Borrower | Loan Amount |
|---|---|---|---|
| Open | Kangethe Patrick | $100,000 | |
| Closed | Celona Jennie M | $100,000 | |
| Previous Owner | Celona Jennie M | $44,650 | |
| Closed | Celona Jennie M | $0 |
Source: Public Records
Tax History
| Year | Tax Paid | Tax Assessment Tax Assessment Total Assessment is a certain percentage of the fair market value that is determined by local assessors to be the total taxable value of land and additions on the property. | Land | Improvement |
|---|---|---|---|---|
| 2025 | $3,490 | $264,600 | $0 | $264,600 |
| 2024 | $3,334 | $242,500 | $0 | $242,500 |
| 2023 | $2,973 | $207,300 | $0 | $207,300 |
| 2022 | $1,562 | $102,700 | $0 | $102,700 |
| 2021 | $1,672 | $102,700 | $0 | $102,700 |
| 2020 | $1,746 | $102,700 | $0 | $102,700 |
| 2019 | $2,749 | $152,700 | $0 | $152,700 |
| 2018 | $2,695 | $142,500 | $0 | $142,500 |
| 2017 | $2,683 | $139,600 | $0 | $139,600 |
| 2016 | $1,845 | $89,500 | $0 | $89,500 |
| 2015 | $2,627 | $130,900 | $0 | $130,900 |
| 2014 | $2,558 | $130,900 | $0 | $130,900 |
Source: Public Records
Map
Nearby Homes
- 13 Vineyard St Unit D
- 13 Vineyard St Unit C
- 13 Vineyard St Unit B
- 13 Vineyard St Unit A
- 13 Vineyard St Unit 1
- 15 Vineyard St
- 5 Vineyard St
- 5 Becket St
- 128 Beaverbrook Pkwy
- 17 Vineyard St
- 3 Vineyard St
- 126 Beaverbrook Pkwy
- 132 Beaverbrook Pkwy
- 124 Beaverbrook Pkwy
- 3 Becket St
- 21 Vineyard St
- 131 Maywood St
- 135 Maywood St
- 136 Beaverbrook Pkwy
- 4 Becket St
Your Personal Tour Guide
Ask me questions while you tour the home.