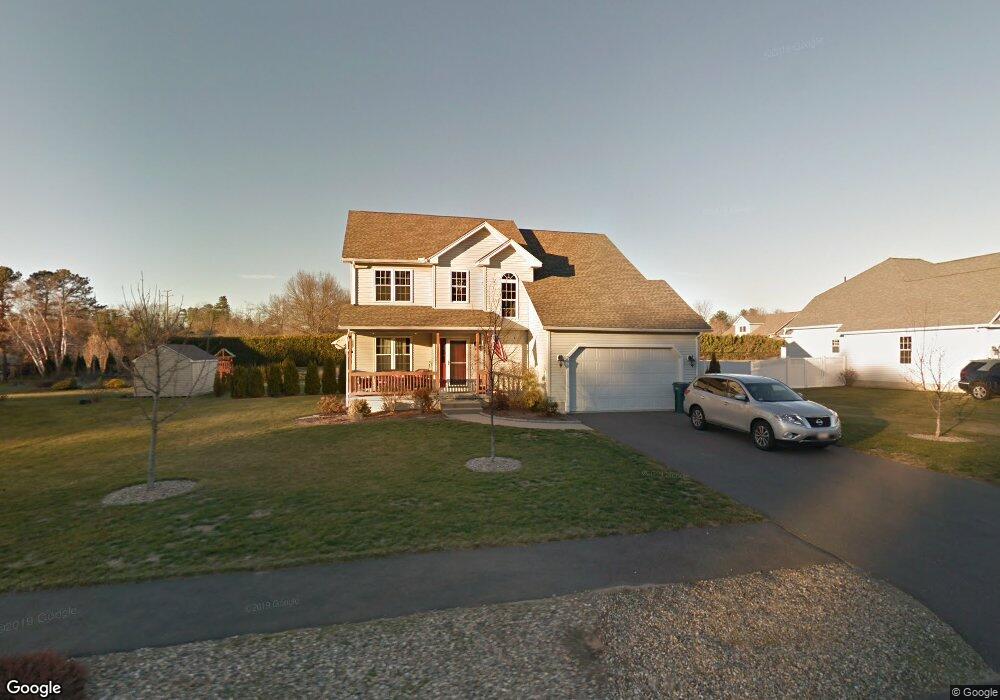
13 Willow Cir Easthampton, MA 01027
Estimated Value: $617,914 - $677,000
4
Beds
3
Baths
1,975
Sq Ft
$328/Sq Ft
Est. Value
About This Home
This home is located at 13 Willow Cir, Easthampton, MA 01027 and is currently estimated at $647,479, approximately $327 per square foot. 13 Willow Cir is a home located in Hampshire County with nearby schools including Easthampton High School, Calvary Baptist Christian School, and Tri-County Schools.
Ownership History
Date
Name
Owned For
Owner Type
Purchase Details
Closed on
Apr 4, 2022
Sold by
Redfern Brian T and Peloquin Judy D
Bought by
Redfern Brian T and Chandler Tina M
Current Estimated Value
Home Financials for this Owner
Home Financials are based on the most recent Mortgage that was taken out on this home.
Original Mortgage
$305,000
Outstanding Balance
$287,270
Interest Rate
4.67%
Mortgage Type
Stand Alone Refi Refinance Of Original Loan
Estimated Equity
$360,209
Purchase Details
Closed on
Aug 26, 2011
Sold by
Crown Meadow Corp
Bought by
Peloquin Judy D and Peloquin Peter P
Home Financials for this Owner
Home Financials are based on the most recent Mortgage that was taken out on this home.
Original Mortgage
$311,888
Interest Rate
4.25%
Mortgage Type
FHA
Create a Home Valuation Report for This Property
The Home Valuation Report is an in-depth analysis detailing your home's value as well as a comparison with similar homes in the area
Home Values in the Area
Average Home Value in this Area
Purchase History
| Date | Buyer | Sale Price | Title Company |
|---|---|---|---|
| Redfern Brian T | -- | None Available | |
| Redfern Brian T | -- | None Available | |
| Peloquin Judy D | $320,000 | -- | |
| Peloquin Judy D | $320,000 | -- | |
| Peloquin Judy D | $320,000 | -- |
Source: Public Records
Mortgage History
| Date | Status | Borrower | Loan Amount |
|---|---|---|---|
| Open | Redfern Brian T | $305,000 | |
| Closed | Redfern Brian T | $305,000 | |
| Previous Owner | Peloquin Judy D | $311,888 |
Source: Public Records
Tax History Compared to Growth
Tax History
| Year | Tax Paid | Tax Assessment Tax Assessment Total Assessment is a certain percentage of the fair market value that is determined by local assessors to be the total taxable value of land and additions on the property. | Land | Improvement |
|---|---|---|---|---|
| 2025 | $7,576 | $554,200 | $131,800 | $422,400 |
| 2024 | $6,659 | $491,100 | $128,000 | $363,100 |
| 2023 | $5,085 | $347,100 | $101,000 | $246,100 |
| 2022 | $5,738 | $347,100 | $101,000 | $246,100 |
| 2021 | $6,314 | $360,000 | $101,000 | $259,000 |
| 2020 | $6,164 | $347,100 | $101,000 | $246,100 |
| 2019 | $5,546 | $358,700 | $117,800 | $240,900 |
| 2018 | $5,339 | $333,700 | $111,000 | $222,700 |
| 2017 | $5,218 | $321,900 | $106,900 | $215,000 |
| 2016 | $4,978 | $319,300 | $106,900 | $212,400 |
| 2015 | $4,837 | $319,300 | $106,900 | $212,400 |
Source: Public Records
Map
Nearby Homes