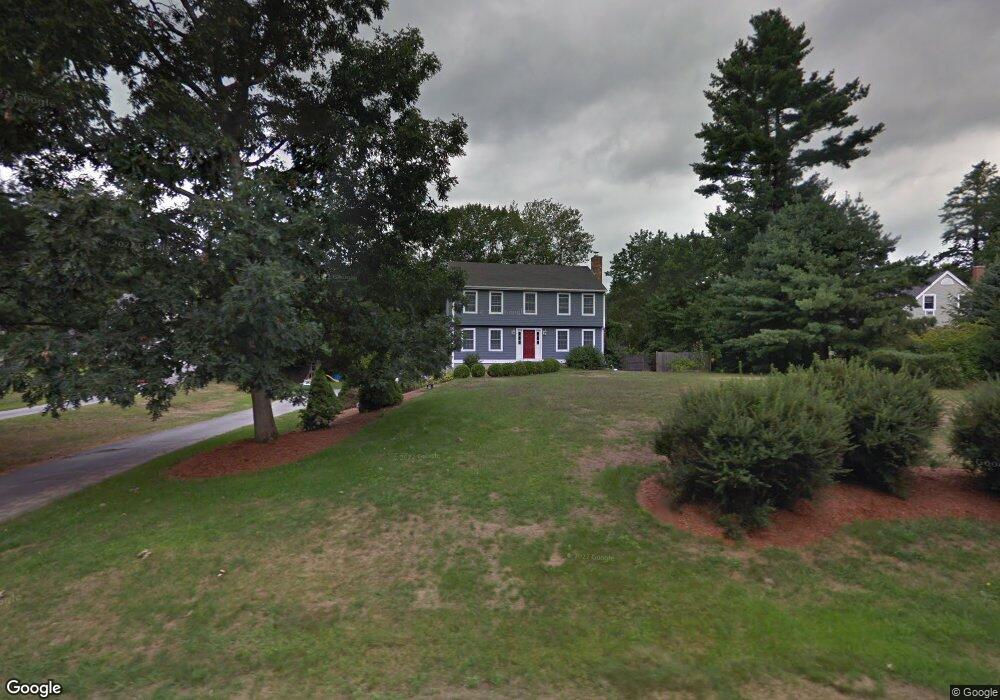
13 Woodside Dr Londonderry, NH 03053
Estimated Value: $630,000 - $657,000
3
Beds
3
Baths
1,800
Sq Ft
$360/Sq Ft
Est. Value
About This Home
This home is located at 13 Woodside Dr, Londonderry, NH 03053 and is currently estimated at $648,721, approximately $360 per square foot. 13 Woodside Dr is a home located in Rockingham County with nearby schools including North Londonderry Elementary School, Londonderry Middle School, and Londonderry Senior High School.
Ownership History
Date
Name
Owned For
Owner Type
Purchase Details
Closed on
Jan 8, 2024
Sold by
Law Alan J and Law Alicia A
Bought by
Law Ft and Law
Current Estimated Value
Purchase Details
Closed on
Sep 17, 2009
Sold by
Sandquist Brett and Bank New York Mellon T
Bought by
Bank New York Mellon T
Purchase Details
Closed on
May 28, 2003
Sold by
Meaney James A and Meaney Sharon J
Bought by
Sandquist Brett and Sandquist Pamela M
Purchase Details
Closed on
Jun 29, 1998
Sold by
Cronin Steven J and Cronin Tara
Bought by
Meaney James A and Meaney Sharon J
Purchase Details
Closed on
Jul 15, 1996
Sold by
Nicoll Steven D and Nicoll Paula M
Bought by
Cronin Steven J
Create a Home Valuation Report for This Property
The Home Valuation Report is an in-depth analysis detailing your home's value as well as a comparison with similar homes in the area
Home Values in the Area
Average Home Value in this Area
Purchase History
| Date | Buyer | Sale Price | Title Company |
|---|---|---|---|
| Law Ft | -- | None Available | |
| Bank New York Mellon T | $212,400 | -- | |
| Sandquist Brett | $289,900 | -- | |
| Meaney James A | $149,900 | -- | |
| Cronin Steven J | $128,000 | -- |
Source: Public Records
Mortgage History
| Date | Status | Borrower | Loan Amount |
|---|---|---|---|
| Previous Owner | Cronin Steven J | $232,654 | |
| Previous Owner | Cronin Steven J | $240,562 | |
| Previous Owner | Cronin Steven J | $75,000 |
Source: Public Records
Tax History Compared to Growth
Tax History
| Year | Tax Paid | Tax Assessment Tax Assessment Total Assessment is a certain percentage of the fair market value that is determined by local assessors to be the total taxable value of land and additions on the property. | Land | Improvement |
|---|---|---|---|---|
| 2024 | $8,185 | $507,100 | $214,700 | $292,400 |
| 2023 | $7,971 | $509,300 | $214,700 | $294,600 |
| 2022 | $7,514 | $406,600 | $161,300 | $245,300 |
| 2021 | $7,473 | $406,600 | $161,300 | $245,300 |
| 2020 | $6,781 | $337,200 | $101,400 | $235,800 |
| 2019 | $6,538 | $337,200 | $101,400 | $235,800 |
| 2018 | $6,143 | $281,800 | $84,100 | $197,700 |
| 2017 | $6,090 | $281,800 | $84,100 | $197,700 |
| 2016 | $6,059 | $281,800 | $84,100 | $197,700 |
| 2015 | $5,923 | $281,800 | $84,100 | $197,700 |
| 2014 | $5,943 | $281,800 | $84,100 | $197,700 |
| 2011 | -- | $292,200 | $84,100 | $208,100 |
Source: Public Records
Map
Nearby Homes
- 8 Iroquois Cir
- 15 Tamarack Ct
- 67 Pullman St
- 53 Pine Ave
- 29 Watts Landing Unit 24
- 4543 Brown Ave
- 4481 Brown Ave
- 15 Harvey Rd
- 3-C Mustang Dr Unit MODEL
- 4243 Brown Ave
- 9 Mustang Dr Unit C
- 9 Mustang Dr Unit B
- 7 Mustang Dr Unit C
- 7 Mustang Dr Unit END UNIT-A
- 769 Daniel Webster Hwy
- 490 Charles Bancroft Hwy
- 5 Webster Rd
- 35 Red Deer Rd
- 34 Chatham Dr
- 25 Chatfield Dr