Estimated Value: $592,075 - $684,000
4
Beds
3
Baths
2,253
Sq Ft
$285/Sq Ft
Est. Value
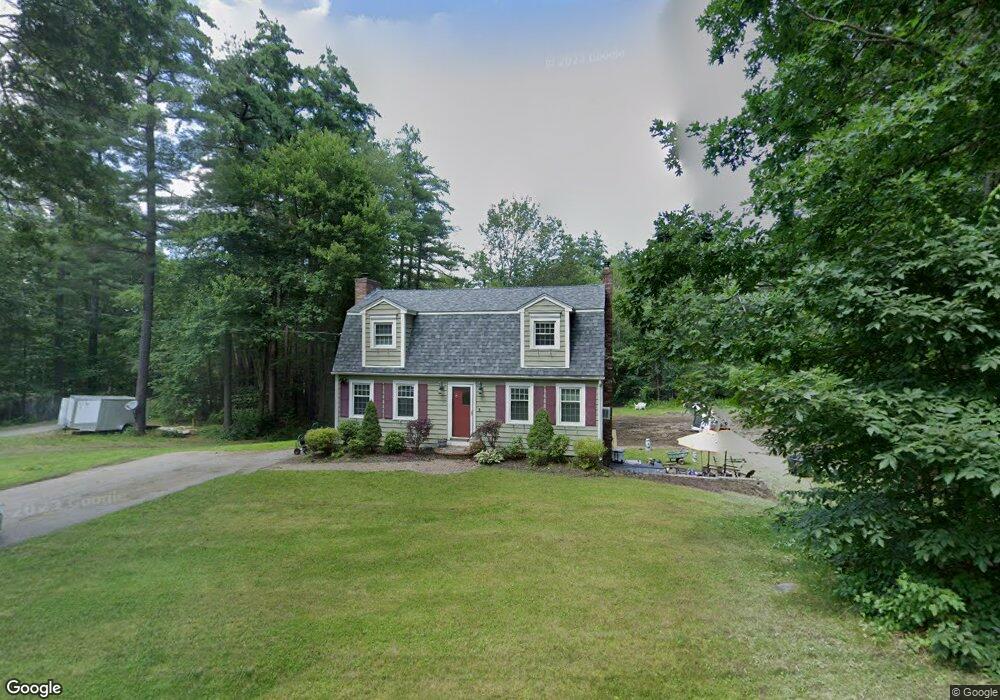
About This Home
This home is located at 130 Goodhue Rd, Derry, NH 03038 and is currently estimated at $641,519, approximately $284 per square foot. 130 Goodhue Rd is a home located in Rockingham County with nearby schools including East Derry Memorial Elementary School, West Running Brook Middle School, and Pinkerton Academy.
Ownership History
Date
Name
Owned For
Owner Type
Purchase Details
Closed on
Jul 15, 2008
Sold by
Carney David
Bought by
Bright Christian
Current Estimated Value
Home Financials for this Owner
Home Financials are based on the most recent Mortgage that was taken out on this home.
Original Mortgage
$304,735
Interest Rate
6.13%
Mortgage Type
VA
Purchase Details
Closed on
Jul 19, 2000
Sold by
Hill James K and Hill Janet R
Bought by
Kuchar Jennifer J
Home Financials for this Owner
Home Financials are based on the most recent Mortgage that was taken out on this home.
Original Mortgage
$173,850
Interest Rate
8.28%
Purchase Details
Closed on
Jul 31, 1996
Sold by
Pelham Bk & Tr Co
Bought by
Hill Jameson K
Purchase Details
Closed on
Mar 18, 1996
Sold by
Garrigus Richard F and Garrigus Diane B
Bought by
Pelham Bk & Tco
Create a Home Valuation Report for This Property
The Home Valuation Report is an in-depth analysis detailing your home's value as well as a comparison with similar homes in the area
Home Values in the Area
Average Home Value in this Area
Purchase History
| Date | Buyer | Sale Price | Title Company |
|---|---|---|---|
| Bright Christian | $295,000 | -- | |
| Kuchar Jennifer J | $183,000 | -- | |
| Hill Jameson K | $88,500 | -- | |
| Pelham Bk & Tco | $71,300 | -- |
Source: Public Records
Mortgage History
| Date | Status | Borrower | Loan Amount |
|---|---|---|---|
| Open | Pelham Bk & Tco | $308,052 | |
| Closed | Pelham Bk & Tco | $316,802 | |
| Closed | Pelham Bk & Tco | $304,735 | |
| Previous Owner | Pelham Bk & Tco | $173,850 |
Source: Public Records
Tax History
| Year | Tax Paid | Tax Assessment Tax Assessment Total Assessment is a certain percentage of the fair market value that is determined by local assessors to be the total taxable value of land and additions on the property. | Land | Improvement |
|---|---|---|---|---|
| 2025 | $9,700 | $510,800 | $209,200 | $301,600 |
| 2024 | $9,547 | $510,800 | $209,200 | $301,600 |
| 2023 | $8,526 | $412,300 | $177,800 | $234,500 |
| 2022 | $7,850 | $412,300 | $177,800 | $234,500 |
| 2021 | $7,586 | $306,400 | $137,700 | $168,700 |
| 2020 | $7,458 | $306,400 | $137,700 | $168,700 |
| 2019 | $7,376 | $282,400 | $108,100 | $174,300 |
| 2018 | $7,351 | $282,400 | $108,100 | $174,300 |
| 2017 | $7,509 | $260,200 | $103,100 | $157,100 |
| 2016 | $7,041 | $260,200 | $103,100 | $157,100 |
| 2015 | $6,948 | $237,700 | $103,100 | $134,600 |
| 2014 | $6,993 | $237,700 | $103,100 | $134,600 |
| 2013 | $7,070 | $224,500 | $95,100 | $129,400 |
Source: Public Records
Map
Nearby Homes
- 343 Island Pond Rd
- 114 Chases Grove Rd
- 35 Steele Rd
- 120 Chases Grove Rd
- 105 Conleys Grove Rd
- 398 N Main St
- 69 Caddy Dr
- 71 Caddy Dr
- 65 Caddy Dr
- 84 Caddy Dr
- 38 Gordon Mountain Rd
- 15 King St
- 128 N Shore Rd
- 60 Shore Dr
- 242 Rockingham Rd
- 64 Trails Edge Rd
- 9 Valcat Ln
- 55 Trails Edge Rd
- 4 Westview Dr
- 53 Trails Edge Rd
Your Personal Tour Guide
Ask me questions while you tour the home.