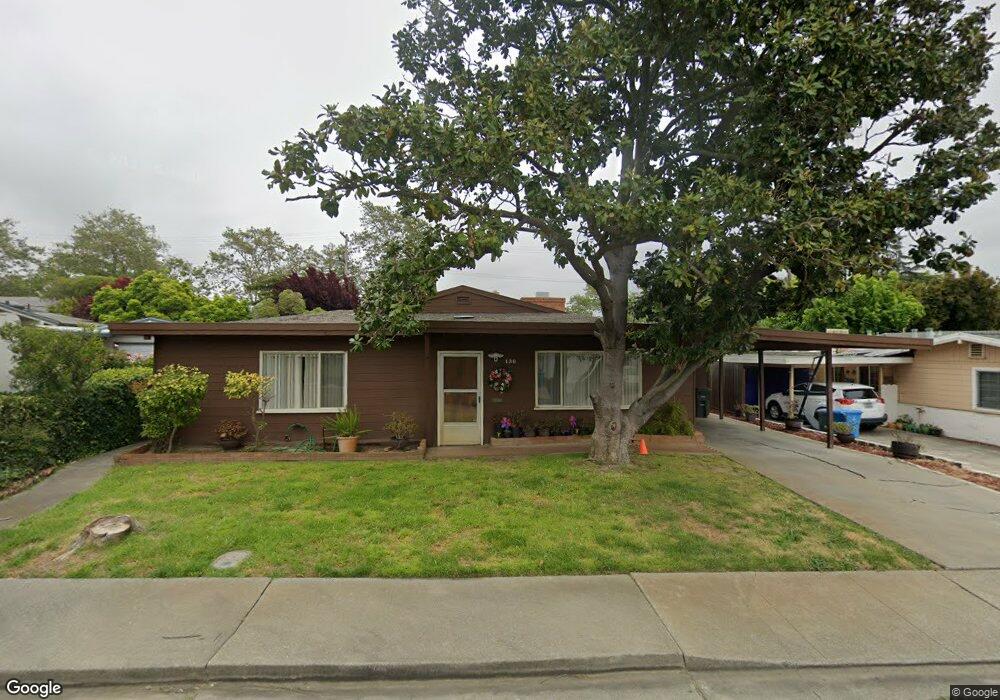
130 Lois Ln Vallejo, CA 94590
West Vallejo NeighborhoodEstimated Value: $539,000 - $645,000
2
Beds
2
Baths
2,148
Sq Ft
$273/Sq Ft
Est. Value
About This Home
This home is located at 130 Lois Ln, Vallejo, CA 94590 and is currently estimated at $586,939, approximately $273 per square foot. 130 Lois Ln is a home located in Solano County with nearby schools including Highland Elementary, Vallejo High School, and Caliber: ChangeMakers Academy.
Ownership History
Date
Name
Owned For
Owner Type
Purchase Details
Closed on
Oct 14, 2020
Sold by
Taft Franklin R
Bought by
Taft Franklin R and Franklin R Taft 2020 Family Tr
Current Estimated Value
Purchase Details
Closed on
Sep 16, 2020
Sold by
Taft Franklin R and Taft Gloria
Bought by
Taft Franklin R
Purchase Details
Closed on
Feb 27, 2018
Sold by
Taft Russell Norman and Taft Bettycille
Bought by
Taft Franklin R and Taft Gloria P
Purchase Details
Closed on
Jul 17, 2015
Sold by
Parker Taft Russell and Taft Bettycille
Bought by
Parker Taft Russell and Taft Bettycille H
Purchase Details
Closed on
Nov 12, 2014
Sold by
Taft Russell P and Taft Bettycille H
Bought by
Taft Russell P and Taft Bettycille H
Purchase Details
Closed on
Nov 9, 1995
Sold by
Taft Carol P
Bought by
Taft Russell Parker and Taft Bettycille
Home Financials for this Owner
Home Financials are based on the most recent Mortgage that was taken out on this home.
Original Mortgage
$120,000
Interest Rate
7.37%
Mortgage Type
Seller Take Back
Create a Home Valuation Report for This Property
The Home Valuation Report is an in-depth analysis detailing your home's value as well as a comparison with similar homes in the area
Home Values in the Area
Average Home Value in this Area
Purchase History
We collect this data history from publicly available records. To have your information removed, we recommend requesting removal directly through your county’s website.
| Date | Buyer | Sale Price | Title Company |
|---|---|---|---|
| Taft Franklin R | -- | None Available | |
| Taft Franklin R | -- | None Available | |
| Taft Franklin R | -- | None Available | |
| Parker Taft Russell | -- | None Available | |
| Taft Russell P | -- | None Available | |
| Taft Russell Parker | $140,000 | Fidelity National Title |
Source: Public Records
Mortgage History
We collect this data history from publicly available records. To have your information removed, we recommend requesting removal directly through your county’s website.
| Date | Status | Borrower | Loan Amount |
|---|---|---|---|
| Previous Owner | Taft Russell Parker | $120,000 |
Source: Public Records
Tax History
| Year | Tax Paid | Tax Assessment Tax Assessment Total Assessment is a certain percentage of the fair market value that is determined by local assessors to be the total taxable value of land and additions on the property. | Land | Improvement |
|---|---|---|---|---|
| 2025 | $4,443 | $298,482 | $75,985 | $222,497 |
| 2024 | $4,443 | $292,631 | $74,496 | $218,135 |
| 2023 | $4,184 | $286,894 | $73,036 | $213,858 |
| 2022 | $4,091 | $281,269 | $71,604 | $209,665 |
| 2021 | $4,000 | $275,754 | $70,200 | $205,554 |
| 2020 | $4,018 | $272,928 | $69,481 | $203,447 |
| 2019 | $3,896 | $267,577 | $68,119 | $199,458 |
| 2018 | $1,471 | $69,662 | $13,567 | $56,095 |
| 2017 | $1,381 | $68,297 | $13,301 | $54,996 |
| 2016 | $809 | $66,959 | $13,041 | $53,918 |
| 2015 | $799 | $65,955 | $12,846 | $53,109 |
| 2014 | $789 | $64,664 | $12,595 | $52,069 |
Source: Public Records
Map
Nearby Homes
- 122 Fleming Ave
- 187 Fleming Ave
- 1012 Mariposa St
- 15 Monte Vista Ave
- 186 Fairmont Ave
- 1306 Mariposa St
- 56 Ventura St
- 1939 Indiana St
- 17 Hanns Ave
- 725 Valle Vista Ave
- 133 Claremont Ave
- 711 State St
- 2015 Tennessee St
- 621 La Cadena St
- 2039 Tennessee St
- 657 Washington St
- 1509 Lassen Ct
- 126 Skyway Dr
- 118 El Verano
- 1208 Amador St
Your Personal Tour Guide
Ask me questions while you tour the home.