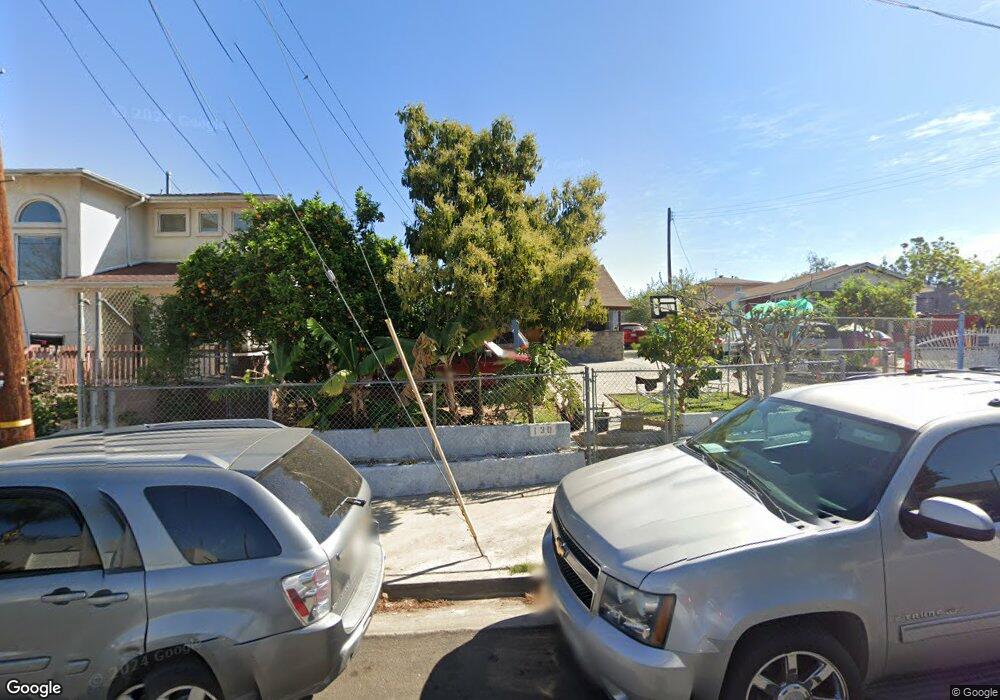
130 N Bonnie Beach Place Los Angeles, CA 90063
Estimated Value: $687,000 - $897,000
4
Beds
1
Bath
1,166
Sq Ft
$651/Sq Ft
Est. Value
About This Home
This home is located at 130 N Bonnie Beach Place, Los Angeles, CA 90063 and is currently estimated at $758,959, approximately $650 per square foot. 130 N Bonnie Beach Place is a home located in Los Angeles County with nearby schools including Belvedere Elementary School, Belvedere Middle School, and Engineering And Technology Academy At Esteban E. Torres High No. 3.
Ownership History
Date
Name
Owned For
Owner Type
Purchase Details
Closed on
Jul 17, 2007
Sold by
Romero Marie Julie
Bought by
Gutierrez Francisco and Romero Marie
Current Estimated Value
Home Financials for this Owner
Home Financials are based on the most recent Mortgage that was taken out on this home.
Original Mortgage
$169,550
Interest Rate
6.41%
Mortgage Type
New Conventional
Purchase Details
Closed on
Jul 11, 2007
Sold by
Gutierrez Francisco
Bought by
Romero Marie J
Home Financials for this Owner
Home Financials are based on the most recent Mortgage that was taken out on this home.
Original Mortgage
$169,550
Interest Rate
6.41%
Mortgage Type
New Conventional
Purchase Details
Closed on
Apr 20, 2001
Sold by
Gutierrez Francisco and Romero Marie J
Bought by
Gutierrez Francisco
Home Financials for this Owner
Home Financials are based on the most recent Mortgage that was taken out on this home.
Original Mortgage
$145,600
Interest Rate
6.98%
Create a Home Valuation Report for This Property
The Home Valuation Report is an in-depth analysis detailing your home's value as well as a comparison with similar homes in the area
Home Values in the Area
Average Home Value in this Area
Purchase History
| Date | Buyer | Sale Price | Title Company |
|---|---|---|---|
| Gutierrez Francisco | -- | None Available | |
| Romero Marie J | -- | Alliance Title Company | |
| Gutierrez Francisco | -- | United Title Company |
Source: Public Records
Mortgage History
| Date | Status | Borrower | Loan Amount |
|---|---|---|---|
| Closed | Romero Marie J | $169,550 | |
| Closed | Gutierrez Francisco | $145,600 |
Source: Public Records
Tax History Compared to Growth
Tax History
| Year | Tax Paid | Tax Assessment Tax Assessment Total Assessment is a certain percentage of the fair market value that is determined by local assessors to be the total taxable value of land and additions on the property. | Land | Improvement |
|---|---|---|---|---|
| 2025 | $4,430 | $309,122 | $200,694 | $108,428 |
| 2024 | $4,430 | $303,061 | $196,759 | $106,302 |
| 2023 | $4,358 | $297,119 | $192,901 | $104,218 |
| 2022 | $4,167 | $291,294 | $189,119 | $102,175 |
| 2021 | $4,118 | $285,583 | $185,411 | $100,172 |
| 2019 | $3,997 | $277,113 | $179,912 | $97,201 |
| 2018 | $3,794 | $271,681 | $176,385 | $95,296 |
| 2016 | $3,630 | $261,134 | $169,537 | $91,597 |
| 2015 | $3,575 | $257,213 | $166,991 | $90,222 |
| 2014 | $3,578 | $252,175 | $163,720 | $88,455 |
Source: Public Records
Map
Nearby Homes
- 120 N Bonnie Beach Place
- 116 N Bonnie Beach Place
- 4017 Michigan Ave
- 3878 E 1st St
- 4126 E 1st St
- 221 N Herbert Ave
- 3935 E Cesar e Chavez Ave
- 3812 E 1st St
- 126 N Eastman Ave
- 0 N Record Ave
- 3900 E 3rd St
- 4264 Capistrano Way
- 4268 Capistrano Way
- 4339 E 1st St
- 445 S Bonnie Beach Place
- 4316 Dozier St
- 1000 N Gage Ave
- 322 N Ditman Ave
- 414 N Ditman Ave
- 3724 Folsom St
- 138 N Bonnie Beach Place
- 124 N Bonnie Beach Place
- 140 N Bonnie Beach Place
- 134 N Bonnie Beach Place
- 142 N Bonnie Beach Place
- 148 N Bonnie Beach Place
- 152 N Bonnie Beach Place
- 123 N Bonnie Beach Place
- 135 N Bonnie Beach Place Unit 2
- 135 N Bonnie Beach Place
- 131 N Bonnie Beach Place
- 137 N Bonnie Beach Place
- 143 N Bonnie Beach Place
- 156 N Bonnie Beach Place
- 3939 E 1st St
- 149 N Bonnie Beach Place
- 164 N Bonnie Beach Place
- 135 N Sunol Dr
- 151 N Bonnie Beach Place
- 157 N Bonnie Beach Place