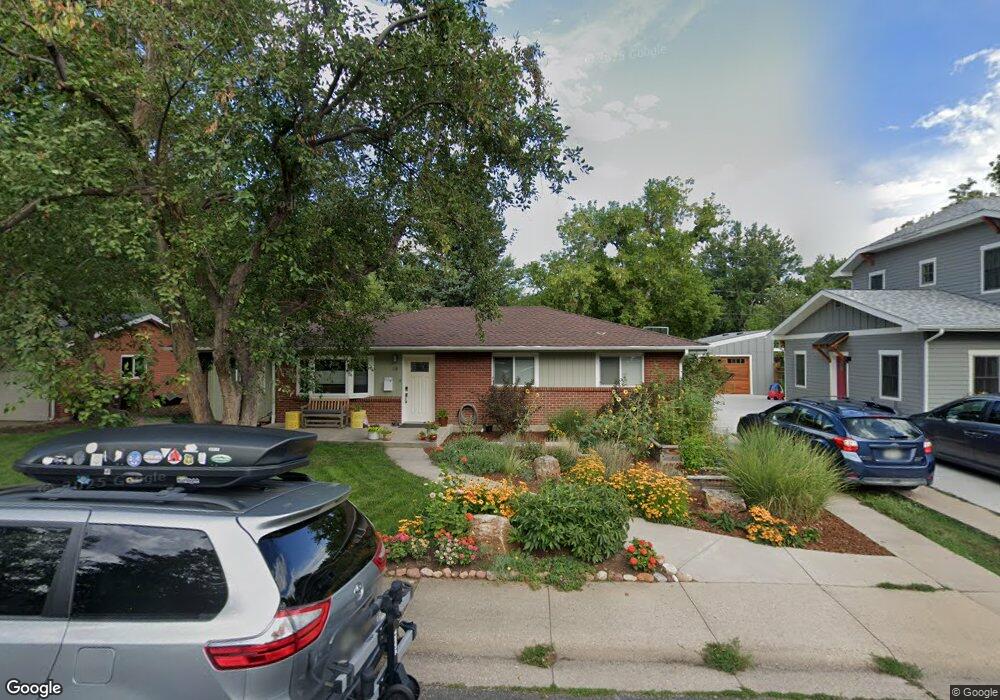
130 S 32nd St Boulder, CO 80305
South Boulder NeighborhoodEstimated Value: $861,910 - $932,000
3
Beds
2
Baths
1,304
Sq Ft
$681/Sq Ft
Est. Value
About This Home
This home is located at 130 S 32nd St, Boulder, CO 80305 and is currently estimated at $888,228, approximately $681 per square foot. 130 S 32nd St is a home located in Boulder County with nearby schools including Creekside Elementary School, Manhattan Middle School of the Arts & Academics, and Fairview High School.
Ownership History
Date
Name
Owned For
Owner Type
Purchase Details
Closed on
Jun 30, 2008
Sold by
Showman Robert J and Showman Jodi L
Bought by
Johnson Andrew David
Current Estimated Value
Home Financials for this Owner
Home Financials are based on the most recent Mortgage that was taken out on this home.
Original Mortgage
$354,800
Outstanding Balance
$229,550
Interest Rate
6.47%
Mortgage Type
Purchase Money Mortgage
Estimated Equity
$658,678
Purchase Details
Closed on
Dec 30, 1993
Sold by
Showman Robert J
Bought by
Showman Robert J
Home Financials for this Owner
Home Financials are based on the most recent Mortgage that was taken out on this home.
Original Mortgage
$72,960
Interest Rate
7.12%
Mortgage Type
FHA
Purchase Details
Closed on
Jan 2, 1987
Bought by
Mckinley Melanie Brooke
Purchase Details
Closed on
Aug 15, 1983
Bought by
Mckinley Melanie Brooke
Purchase Details
Closed on
Jun 9, 1981
Bought by
Mckinley Melanie Brooke
Create a Home Valuation Report for This Property
The Home Valuation Report is an in-depth analysis detailing your home's value as well as a comparison with similar homes in the area
Home Values in the Area
Average Home Value in this Area
Purchase History
| Date | Buyer | Sale Price | Title Company |
|---|---|---|---|
| Johnson Andrew David | $443,500 | American Liberty Title | |
| Showman Robert J | $500 | -- | |
| Mckinley Melanie Brooke | $76,000 | -- | |
| Mckinley Melanie Brooke | -- | -- | |
| Mckinley Melanie Brooke | -- | -- |
Source: Public Records
Mortgage History
| Date | Status | Borrower | Loan Amount |
|---|---|---|---|
| Open | Johnson Andrew David | $354,800 | |
| Previous Owner | Showman Robert J | $72,960 |
Source: Public Records
Tax History
| Year | Tax Paid | Tax Assessment Tax Assessment Total Assessment is a certain percentage of the fair market value that is determined by local assessors to be the total taxable value of land and additions on the property. | Land | Improvement |
|---|---|---|---|---|
| 2025 | $5,362 | $56,219 | $28,856 | $27,363 |
| 2024 | $5,362 | $56,219 | $28,856 | $27,363 |
| 2023 | $5,269 | $61,017 | $33,942 | $30,760 |
| 2022 | $4,704 | $50,659 | $25,708 | $24,951 |
| 2021 | $4,486 | $52,117 | $26,448 | $25,669 |
| 2020 | $4,205 | $48,313 | $25,454 | $22,859 |
| 2019 | $4,141 | $48,313 | $25,454 | $22,859 |
| 2018 | $3,733 | $43,056 | $23,472 | $19,584 |
| 2017 | $3,616 | $47,601 | $25,950 | $21,651 |
| 2016 | $3,341 | $38,590 | $16,318 | $22,272 |
| 2015 | $3,163 | $32,366 | $16,557 | $15,809 |
| 2014 | $2,721 | $32,366 | $16,557 | $15,809 |
Source: Public Records
Map
Nearby Homes
- 3000 Dartmouth Ave
- 2955 Stanford Ave
- 345 S 38th St
- 3805 Martin Dr
- 2585 Kohler Dr
- 210 S 39th St
- 450 S 41st St
- 2250 Bluebell Ave
- 2235 Vassar Dr
- 245 Fair Place
- 805 29th St Unit 253
- 805 29th St Unit 157
- 805 29th St Unit 402
- 805 29th St Unit 404
- 2221 Columbine Ave
- 4453 Hamilton Ct
- 780 33rd St
- 370 20th St
- 1965 Kohler Dr
- 2032 Mariposa Ave
Your Personal Tour Guide
Ask me questions while you tour the home.