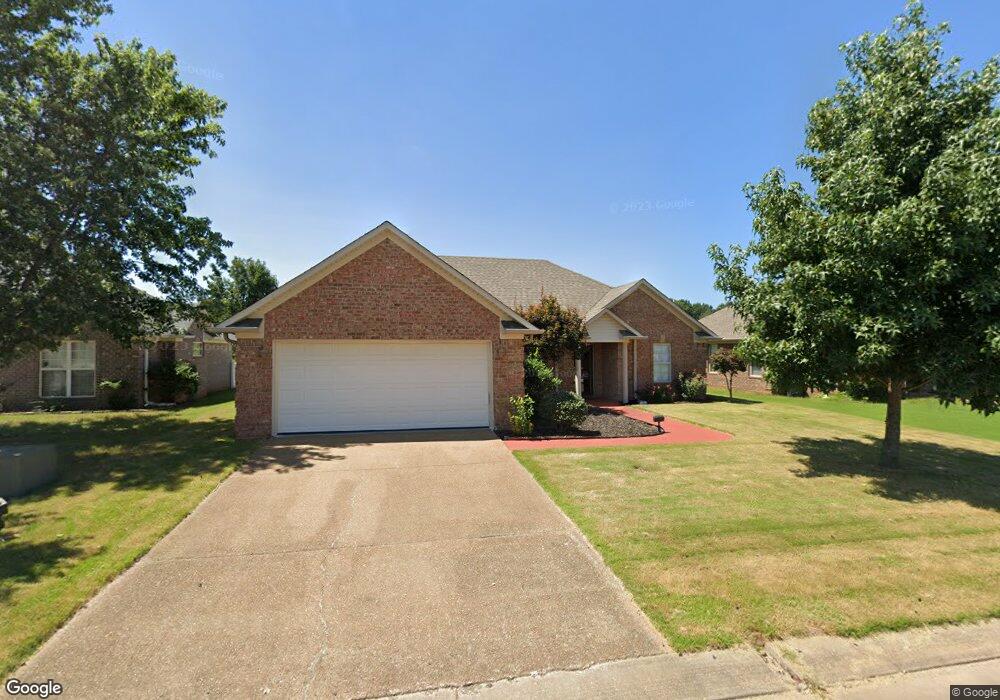
130 Stone Spring Cir Jackson, TN 38305
Estimated Value: $233,462 - $274,000
3
Beds
2
Baths
1,499
Sq Ft
$170/Sq Ft
Est. Value
About This Home
This home is located at 130 Stone Spring Cir, Jackson, TN 38305 and is currently estimated at $255,366, approximately $170 per square foot. 130 Stone Spring Cir is a home located in Madison County with nearby schools including Pope School, Northeast Middle School, and North Side High School.
Ownership History
Date
Name
Owned For
Owner Type
Purchase Details
Closed on
Sep 10, 2012
Sold by
Ganick Elaine L
Bought by
Chaffin Eugene F and Chaffin Carolyn Joy
Current Estimated Value
Purchase Details
Closed on
Apr 28, 2006
Sold by
Conbstruction Dtb
Bought by
Ganick Elaine L
Home Financials for this Owner
Home Financials are based on the most recent Mortgage that was taken out on this home.
Original Mortgage
$95,920
Interest Rate
6.28%
Purchase Details
Closed on
Apr 18, 2006
Sold by
Dtb Construction
Bought by
Ganick Elaine L
Home Financials for this Owner
Home Financials are based on the most recent Mortgage that was taken out on this home.
Original Mortgage
$95,920
Interest Rate
6.28%
Purchase Details
Closed on
Jul 25, 2005
Sold by
Cedarwood Estates Llc
Bought by
Dtb Construction & Plumbing Inc
Create a Home Valuation Report for This Property
The Home Valuation Report is an in-depth analysis detailing your home's value as well as a comparison with similar homes in the area
Home Values in the Area
Average Home Value in this Area
Purchase History
| Date | Buyer | Sale Price | Title Company |
|---|---|---|---|
| Chaffin Eugene F | $110,000 | -- | |
| Ganick Elaine L | $119,900 | -- | |
| Ganick Elaine L | $119,900 | -- | |
| Dtb Construction & Plumbing Inc | $22,500 | -- |
Source: Public Records
Mortgage History
| Date | Status | Borrower | Loan Amount |
|---|---|---|---|
| Previous Owner | Dtb Construction & Plumbing Inc | $95,920 | |
| Previous Owner | Dtb Construction & Plumbing Inc | $17,985 |
Source: Public Records
Tax History Compared to Growth
Tax History
| Year | Tax Paid | Tax Assessment Tax Assessment Total Assessment is a certain percentage of the fair market value that is determined by local assessors to be the total taxable value of land and additions on the property. | Land | Improvement |
|---|---|---|---|---|
| 2024 | $880 | $46,975 | $6,250 | $40,725 |
| 2022 | $1,637 | $46,975 | $6,250 | $40,725 |
| 2021 | $1,371 | $31,800 | $5,875 | $25,925 |
| 2020 | $1,371 | $31,800 | $5,875 | $25,925 |
| 2019 | $1,371 | $31,800 | $5,875 | $25,925 |
| 2018 | $1,371 | $31,800 | $5,875 | $25,925 |
| 2017 | $1,332 | $30,200 | $5,875 | $24,325 |
| 2016 | $1,241 | $30,200 | $5,875 | $24,325 |
| 2015 | $1,242 | $30,200 | $5,875 | $24,325 |
| 2014 | $1,242 | $30,200 | $5,875 | $24,325 |
Source: Public Records
Map
Nearby Homes
- 138 Stone Spring Cir
- 124 Stone Spring Cir
- 144 Stone Spring Cir
- 118 Stone Spring Cir
- 129 Stone Spring Cir
- 137 Stone Spring Cir
- 121 Stone Spring Cir
- 150 Stone Spring Cir
- 340 Hidden Springs Ln
- 147 Stone Spring Cir
- 111 Stone Springs Cir
- 111 Stone Spring Cir
- 334 Hidden Springs Ln
- 41 Cedarbrook Place
- 33 Cedarbrook Place
- 153 Stone Spring Cir
- 101 Stone Spring Cir
- 106 Stone Spring Cir
- 25 Cedarbrook Place
- 45 Cedarbrook Place