
$75,000
- 1 Bed
- 1 Bath
- 739 Sq Ft
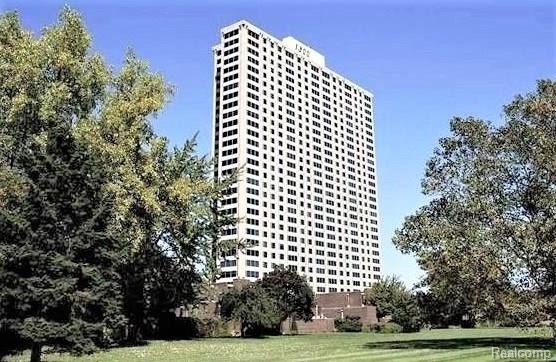
- 1300 E Lafayette St
- Unit 1209
- Detroit, MI
Historic Lafayette Park. Enjoy the view while overlooking the beauty of the city of Detroit from the 12th floor. Situated just steps from the GM Renaissance Center, Greektown, Ford Field, the Detroit Riverwalk, and Eastern Market. This 1-bedroom, 1 bathroom co-op apartment offers unparalleled access to shopping, dining, and entertainment. A 24 hour Doorman provides a concierge style and security.
Alan Beeks EXP Realty Main