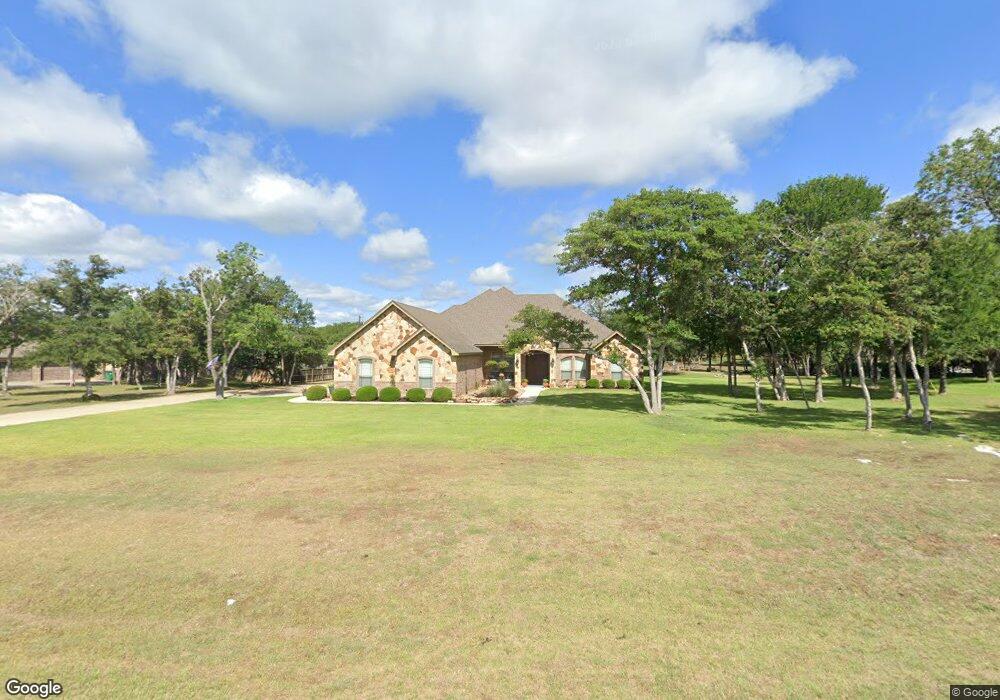
1300 Frederick Ln Temple, TX 76502
North Temple NeighborhoodEstimated Value: $595,566 - $646,000
Studio
--
Bath
2,901
Sq Ft
$217/Sq Ft
Est. Value
About This Home
This home is located at 1300 Frederick Ln, Temple, TX 76502 and is currently estimated at $628,642, approximately $216 per square foot. 1300 Frederick Ln is a home with nearby schools including High Point Elementary School, North Belton Middle, and Lake Belton H.S..
Ownership History
Date
Name
Owned For
Owner Type
Purchase Details
Closed on
Feb 23, 2011
Sold by
3-R Construction L L C
Bought by
Rozner John W and Rozner Sharon G
Current Estimated Value
Home Financials for this Owner
Home Financials are based on the most recent Mortgage that was taken out on this home.
Original Mortgage
$302,100
Outstanding Balance
$205,933
Interest Rate
4.7%
Mortgage Type
New Conventional
Estimated Equity
$422,709
Purchase Details
Closed on
Aug 26, 2010
Sold by
Kaspar Charles and Kaspar Janene
Bought by
3-R Construction Llc
Home Financials for this Owner
Home Financials are based on the most recent Mortgage that was taken out on this home.
Original Mortgage
$37,600
Interest Rate
4.6%
Mortgage Type
Purchase Money Mortgage
Purchase Details
Closed on
Jun 4, 2008
Sold by
Cedar Oaks Estates Ltd
Bought by
Kaspar Charles and Kaspar Janene
Create a Home Valuation Report for This Property
The Home Valuation Report is an in-depth analysis detailing your home's value as well as a comparison with similar homes in the area
Home Values in the Area
Average Home Value in this Area
Purchase History
| Date | Buyer | Sale Price | Title Company |
|---|---|---|---|
| Rozner John W | -- | Monteith Abstract & Title Co | |
| 3-R Construction Llc | -- | Monteith Abstract & Title Co | |
| Kaspar Charles | -- | Monteith Abstract & Title Co |
Source: Public Records
Mortgage History
| Date | Status | Borrower | Loan Amount |
|---|---|---|---|
| Open | Rozner John W | $302,100 | |
| Previous Owner | 3-R Construction Llc | $37,600 |
Source: Public Records
Tax History
| Year | Tax Paid | Tax Assessment Tax Assessment Total Assessment is a certain percentage of the fair market value that is determined by local assessors to be the total taxable value of land and additions on the property. | Land | Improvement |
|---|---|---|---|---|
| 2025 | $8,158 | $598,212 | $51,836 | $546,376 |
| 2024 | $7,801 | $598,212 | $51,836 | $546,376 |
| 2023 | $10,734 | $731,915 | $51,836 | $680,079 |
| 2022 | $10,276 | $611,976 | $51,836 | $560,140 |
| 2021 | $10,226 | $570,094 | $51,836 | $518,258 |
| 2020 | $8,961 | $467,057 | $51,836 | $415,221 |
| 2019 | $8,852 | $430,150 | $46,653 | $383,497 |
| 2018 | $8,735 | $424,439 | $46,653 | $377,786 |
| 2017 | $7,917 | $417,781 | $46,653 | $371,128 |
| 2016 | $7,801 | $411,639 | $46,653 | $364,986 |
| 2015 | $7,380 | $395,466 | $46,653 | $348,813 |
| 2014 | $7,380 | $389,418 | $0 | $0 |
Source: Public Records
Map
Nearby Homes
- 4842 Nibling Ln
- 1084 Frederick Ln
- 3 N Walnut Ct
- 82 Great Loop W
- 203 Sand Flat Ln
- 8 Sycamore Ct
- 103 Cottonwood Loop
- 157 Metheglin Dr
- 5008 Lakeaire Cir
- 223 Sand Flat Ln
- 12 Magnolia Ct
- 8 Hawthorn Ct
- 230 Sand Flat Ln
- 5275 Breaker Cir
- 5265 Lakeaire Blvd
- 1292 Cedar Oaks Cir
- 29 Artesian Dr
- 53 Buttercup Loop
- 49 Buttercup Loop
- 5411 Tiller Ln
- 1320 Frederick Ln
- 1292 Frederick Ln
- 1292 Fredrick Ln
- 1327 Fredrick Ln
- 1309 Frederick Ln
- 1295 Frederick Ln
- 302 Mikey Ln
- 1287 Fredrick Ln
- 1284 Fredrick Ln
- 1332 Fredrick Ln
- 309 Mikey Ln
- 1333 Fredrick Ln
- 2323 Allena Ln
- 1279 Fredrick Ln
- 256 Mikey Ln
- 2292 Allena Ln
- 1278 Fredrick Ln
- 1346 Fredrick Ln
- 2276 Allena Ln
- 146 Mikey Ln
Your Personal Tour Guide
Ask me questions while you tour the home.