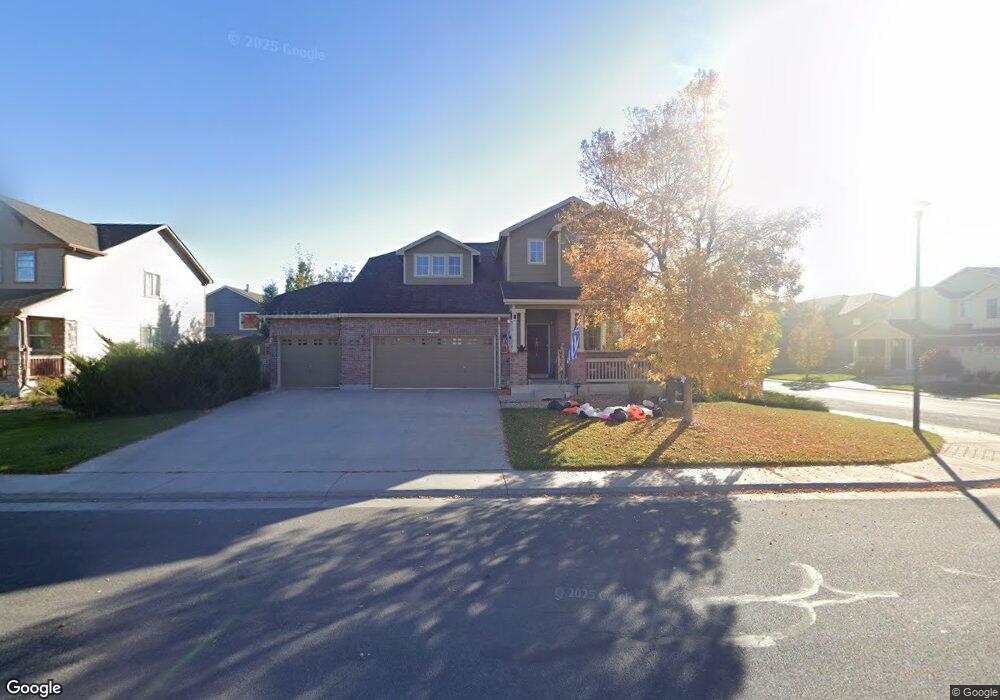
13000 Niagara Way Thornton, CO 80602
Estimated Value: $599,000 - $633,000
3
Beds
3
Baths
2,337
Sq Ft
$265/Sq Ft
Est. Value
About This Home
This home is located at 13000 Niagara Way, Thornton, CO 80602 and is currently estimated at $620,315, approximately $265 per square foot. 13000 Niagara Way is a home located in Adams County with nearby schools including West Ridge Elementary School, Shore Acres Elementary School, and Elderberry Elementary.
Ownership History
Date
Name
Owned For
Owner Type
Purchase Details
Closed on
Mar 11, 2024
Sold by
Naclerio Michael J and Naclerio Kristina M
Bought by
Michael And Kristina Naclerio Living Trust
Current Estimated Value
Purchase Details
Closed on
Sep 8, 2021
Sold by
Naclerio Michael J
Bought by
Naclerio Michael J and Naclerio Kristina M
Home Financials for this Owner
Home Financials are based on the most recent Mortgage that was taken out on this home.
Original Mortgage
$365,000
Interest Rate
2.8%
Mortgage Type
New Conventional
Purchase Details
Closed on
Mar 30, 2007
Sold by
Melody Homes Inc
Bought by
Naclerio Michael J
Home Financials for this Owner
Home Financials are based on the most recent Mortgage that was taken out on this home.
Original Mortgage
$261,491
Interest Rate
6.3%
Mortgage Type
Unknown
Create a Home Valuation Report for This Property
The Home Valuation Report is an in-depth analysis detailing your home's value as well as a comparison with similar homes in the area
Home Values in the Area
Average Home Value in this Area
Purchase History
| Date | Buyer | Sale Price | Title Company |
|---|---|---|---|
| Michael And Kristina Naclerio Living Trust | -- | None Listed On Document | |
| Naclerio Michael J | -- | Heritage Title Company | |
| Naclerio Michael J | $326,864 | Land Title Guarantee Company |
Source: Public Records
Mortgage History
| Date | Status | Borrower | Loan Amount |
|---|---|---|---|
| Previous Owner | Naclerio Michael J | $365,000 | |
| Previous Owner | Naclerio Michael J | $261,491 |
Source: Public Records
Tax History Compared to Growth
Tax History
| Year | Tax Paid | Tax Assessment Tax Assessment Total Assessment is a certain percentage of the fair market value that is determined by local assessors to be the total taxable value of land and additions on the property. | Land | Improvement |
|---|---|---|---|---|
| 2024 | $3,773 | $37,070 | $8,190 | $28,880 |
| 2023 | $3,755 | $42,420 | $7,440 | $34,980 |
| 2022 | $2,891 | $30,600 | $7,300 | $23,300 |
| 2021 | $2,891 | $30,600 | $7,300 | $23,300 |
| 2020 | $2,721 | $30,060 | $7,870 | $22,190 |
| 2019 | $2,724 | $30,060 | $7,870 | $22,190 |
| 2018 | $2,418 | $26,670 | $6,840 | $19,830 |
| 2017 | $2,414 | $26,670 | $6,840 | $19,830 |
| 2016 | $2,135 | $23,500 | $4,940 | $18,560 |
| 2015 | $2,130 | $23,500 | $4,940 | $18,560 |
| 2014 | -- | $20,930 | $4,220 | $16,710 |
Source: Public Records
Map
Nearby Homes
- 12845 Jasmine Way
- 6791 E 129th Ave
- 6731 E 128th Place
- 12926 Jasmine Ct
- 13068 Kearney St
- 6893 E 132nd Place
- 12754 Leyden St Unit E
- 12774 Leyden St Unit D
- 12733 Leyden St Unit C
- 13305 Monaco Ct
- 12812 Jasmine St Unit C
- 13234 Krameria St
- Pearl Plan at Creekside Village
- Hemingway Plan at Creekside Village
- 7037 E 126th Place
- 7047 E 126th Place
- 13391 Locust Ct
- 15372 Jersey Ct
- 12740 Jasmine St Unit F
- 7066 E 126th Place
- 13006 Niagara Way
- 13009 Niagara St
- 13003 Niagara St
- 6662 E 130th Ave
- 13010 Niagara Way
- 6682 E 130th Ave
- 13001 Niagara Way
- 6642 E 130th Ave
- 13013 Niagara St
- 13007 Niagara Way
- 6692 E 130th Ave
- 13014 Niagara Way
- 6622 E 130th Ave
- 13011 Niagara Way
- 13017 Niagara St
- 6665 E 129th Place
- 6675 E 129th Place
- 13004 Magnolia St
- 13002 Niagara St
- 6645 E 129th Place