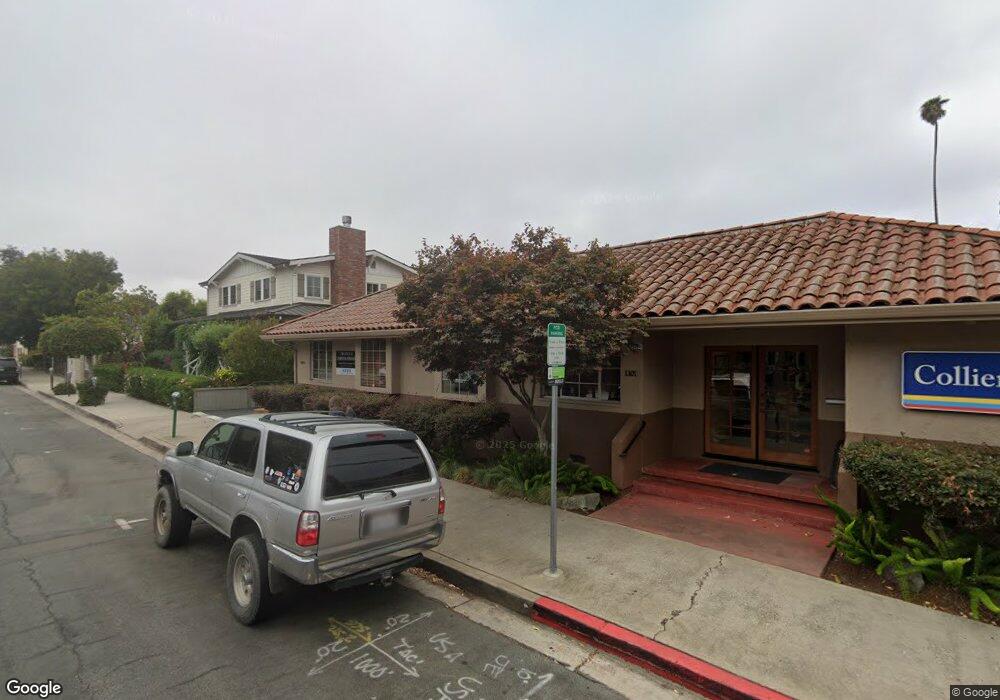
1301 Chorro St Unit A San Luis Obispo, CA 93401
Downtown San Luis Obispo NeighborhoodEstimated Value: $1,156,923
--
Bed
2
Baths
2,478
Sq Ft
$467/Sq Ft
Est. Value
About This Home
This home is located at 1301 Chorro St Unit A, San Luis Obispo, CA 93401 and is currently estimated at $1,156,923, approximately $466 per square foot. 1301 Chorro St Unit A is a home located in San Luis Obispo County with nearby schools including Laguna Middle School, San Luis Obispo High School, and San Luis Obispo Classical Academy.
Ownership History
Date
Name
Owned For
Owner Type
Purchase Details
Closed on
Jul 30, 2015
Sold by
Kamm Charles H and The Charles H Kamm 2001 Trust
Bought by
Chorro Pacific Llc
Current Estimated Value
Home Financials for this Owner
Home Financials are based on the most recent Mortgage that was taken out on this home.
Original Mortgage
$500,000
Outstanding Balance
$392,578
Interest Rate
3.98%
Mortgage Type
Commercial
Estimated Equity
$764,345
Purchase Details
Closed on
Oct 31, 2003
Sold by
Neal Robert E and Neal Mary V
Bought by
Chorro Pacific Llc
Home Financials for this Owner
Home Financials are based on the most recent Mortgage that was taken out on this home.
Original Mortgage
$500,000
Interest Rate
5.89%
Mortgage Type
Seller Take Back
Purchase Details
Closed on
Aug 1, 2001
Sold by
Kamm Charles H
Bought by
Kamm Charles H and Charles H Kamm Trust
Purchase Details
Closed on
May 1, 2001
Sold by
Truesdale Calvin L and Calvin L Truesdale Trust
Bought by
Neal Robert E and Neal Mary V
Create a Home Valuation Report for This Property
The Home Valuation Report is an in-depth analysis detailing your home's value as well as a comparison with similar homes in the area
Home Values in the Area
Average Home Value in this Area
Purchase History
| Date | Buyer | Sale Price | Title Company |
|---|---|---|---|
| Chorro Pacific Llc | $285,000 | None Available | |
| Chorro Pacific Llc | $533,500 | Cuesta Title Company | |
| Kamm Charles H | -- | -- | |
| Neal Robert E | $80,000 | Cuesta Title Company |
Source: Public Records
Mortgage History
| Date | Status | Borrower | Loan Amount |
|---|---|---|---|
| Open | Chorro Pacific Llc | $500,000 | |
| Previous Owner | Chorro Pacific Llc | $500,000 |
Source: Public Records
Tax History Compared to Growth
Tax History
| Year | Tax Paid | Tax Assessment Tax Assessment Total Assessment is a certain percentage of the fair market value that is determined by local assessors to be the total taxable value of land and additions on the property. | Land | Improvement |
|---|---|---|---|---|
| 2025 | $11,871 | $1,095,649 | $513,277 | $582,372 |
| 2024 | $11,657 | $1,074,166 | $503,213 | $570,953 |
| 2023 | $11,657 | $1,053,105 | $493,347 | $559,758 |
| 2022 | $10,926 | $1,032,457 | $483,674 | $548,783 |
| 2021 | $10,752 | $1,012,214 | $474,191 | $538,023 |
| 2020 | $10,642 | $1,001,836 | $469,329 | $532,507 |
| 2019 | $10,532 | $982,193 | $460,127 | $522,066 |
| 2018 | $10,325 | $962,935 | $451,105 | $511,830 |
| 2017 | $10,123 | $944,055 | $442,260 | $501,795 |
| 2016 | $9,924 | $689,725 | $317,682 | $372,043 |
| 2015 | $7,283 | $679,366 | $312,911 | $366,455 |
| 2014 | -- | $666,059 | $306,782 | $359,277 |
Source: Public Records
Map
Nearby Homes
- 1328 Morro St Unit 130
- 880 Buchon St
- 717 Islay St
- 581 Higuera St Unit 302
- 581 Higuera St Unit 207
- 581 Higuera St Unit 208
- 581 Higuera St Unit 301
- 581 Higuera St Unit 210
- 581 Higuera St Unit 307
- 581 Higuera St Unit 201
- 581 Higuera St Unit 203
- 581 Higuera St Unit 308
- 581 Higuera St Unit 306
- 1407 Beach St
- 1700 Osos St
- 442 Buchon St
- 570 Peach St Unit 25
- 680 Chorro St Unit 5
- 1263 Pismo St
- 670 Chorro St Unit D
- 1317 Chorro St
- 1306 Chorro St
- 1308 Garden St
- 1304 Garden St
- 16111613 Garden St
- 1318 Garden St
- 1334 Garden St
- 1326 Chorro St Unit LL
- 1326 Chorro St Unit L1
- 871 Pacific St
- 871 Pacific St
- 873 Pacific St
- 873 Pacific St
- 1334 Chorro St
- 867 Pacific St
- 863 Pacific St
- 863 Pacific St Unit A
- 867 Pacific St Unit A
- 867 Pacific St Unit 220
- 1241 Garden St