1301 Skycrest Dr Unit 3 Walnut Creek, CA 94595
Rossmoor NeighborhoodEstimated Value: $305,000 - $360,000
1
Bed
1
Bath
726
Sq Ft
$453/Sq Ft
Est. Value
About This Home
This home is located at 1301 Skycrest Dr Unit 3, Walnut Creek, CA 94595 and is currently estimated at $328,550, approximately $452 per square foot. 1301 Skycrest Dr Unit 3 is a home located in Contra Costa County with nearby schools including Parkmead Elementary School, Walnut Creek Intermediate School, and Las Lomas High School.
Ownership History
Date
Name
Owned For
Owner Type
Purchase Details
Closed on
Jun 25, 2015
Sold by
Spiegel Joann M
Bought by
Spiegel Joann M
Current Estimated Value
Purchase Details
Closed on
Feb 26, 2014
Sold by
Dondero Vivian J
Bought by
Spiegel Joann Marie
Purchase Details
Closed on
Jan 26, 2011
Sold by
Wells Fargo Bank Na
Bought by
Dondero Vivian J
Purchase Details
Closed on
Oct 7, 2010
Sold by
Agriesti Paul
Bought by
Wells Fargo Bank Na
Purchase Details
Closed on
Apr 10, 2003
Sold by
Cogswell Edmond D
Bought by
Agriesti Paul
Home Financials for this Owner
Home Financials are based on the most recent Mortgage that was taken out on this home.
Original Mortgage
$96,000
Interest Rate
5.6%
Mortgage Type
Stand Alone First
Create a Home Valuation Report for This Property
The Home Valuation Report is an in-depth analysis detailing your home's value as well as a comparison with similar homes in the area
Home Values in the Area
Average Home Value in this Area
Purchase History
| Date | Buyer | Sale Price | Title Company |
|---|---|---|---|
| Spiegel Joann M | -- | None Available | |
| Spiegel Joann Marie | $165,000 | Old Republic Title Company | |
| Dondero Vivian J | $70,000 | North American Title Co Inc | |
| Wells Fargo Bank Na | $84,164 | Accommodation | |
| Agriesti Paul | $120,000 | North American Title |
Source: Public Records
Mortgage History
| Date | Status | Borrower | Loan Amount |
|---|---|---|---|
| Previous Owner | Agriesti Paul | $96,000 |
Source: Public Records
Tax History Compared to Growth
Tax History
| Year | Tax Paid | Tax Assessment Tax Assessment Total Assessment is a certain percentage of the fair market value that is determined by local assessors to be the total taxable value of land and additions on the property. | Land | Improvement |
|---|---|---|---|---|
| 2025 | $3,071 | $190,979 | $110,323 | $80,656 |
| 2024 | $2,997 | $187,235 | $108,160 | $79,075 |
| 2023 | $2,997 | $183,565 | $106,040 | $77,525 |
| 2022 | $2,983 | $179,966 | $103,961 | $76,005 |
| 2021 | $2,901 | $176,438 | $101,923 | $74,515 |
| 2019 | $2,809 | $171,205 | $98,900 | $72,305 |
| 2018 | $2,729 | $167,849 | $96,961 | $70,888 |
| 2017 | $2,663 | $164,559 | $95,060 | $69,499 |
| 2016 | $2,596 | $161,334 | $93,197 | $68,137 |
| 2015 | $2,534 | $158,912 | $91,798 | $67,114 |
| 2014 | $1,193 | $64,378 | $31,353 | $33,025 |
Source: Public Records
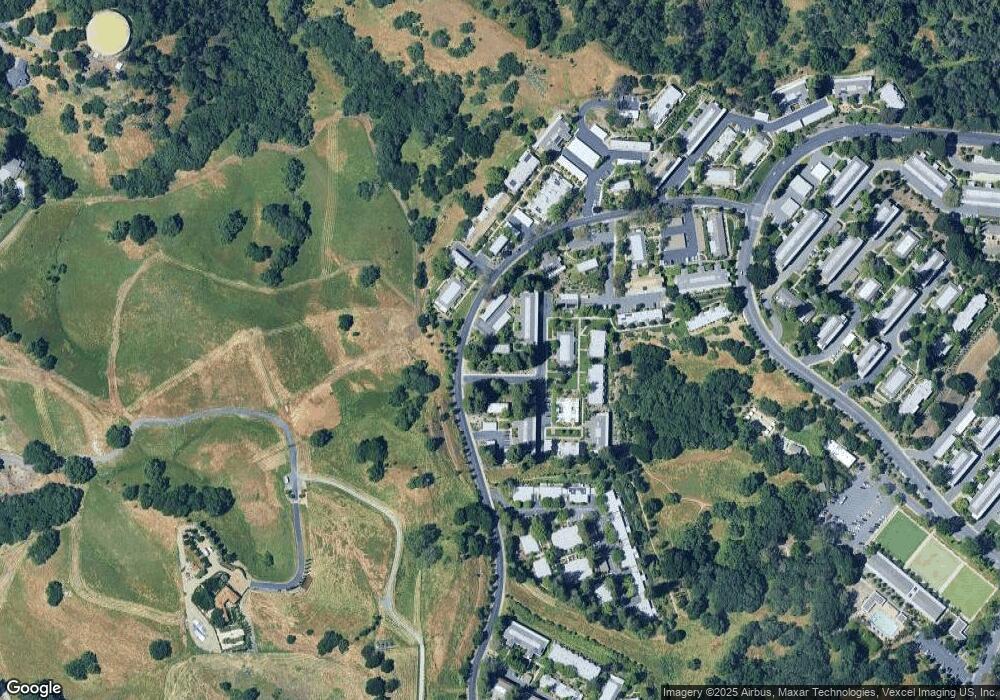
Map
Nearby Homes
- 1817 Skycrest Dr Unit 4
- 1909 Skycrest Dr Unit 2
- 2001 Skycrest Dr Unit 4
- 3117 Golden Rain Rd Unit 12
- 2573 Golden Rain Rd Unit 4
- 2601 Pine Knoll Dr Unit 8
- 2601 Pine Knoll Dr Unit 4
- 18 Diablo Oaks Way
- 2709 Golden Rain Rd Unit 6
- 2041 Golden Rain Rd Unit 4
- 1732 Oakmont Dr Unit 8
- 2133 Golden Rain Rd Unit 12
- 2409 Golden Rain Rd Unit 6
- 2501 Pine Knoll Dr Unit 8
- 2101 Golden Rain Rd Unit 14
- 2425 Pine Knoll Dr Unit 1
- 1935 Golden Rain Rd Unit 1
- 940 Reliez Station Ln
- 3523 Freeman Rd
- 2300 Pine Knoll Dr Unit 1
- 1301 Skycrest Dr Unit 4
- 1301 Skycrest Dr Unit 2
- 1301 Skycrest Dr Unit 1
- 1309 Skycrest Dr Unit 3
- 1309 Skycrest Dr Unit 2
- 1309 Skycrest Dr Unit 1
- 1309 Skycrest Dr Unit 12
- 1309 Skycrest Dr Unit 11
- 1309 Skycrest Dr Unit 10
- 1309 Skycrest Dr Unit 9
- 1309 Skycrest Dr Unit 8
- 1309 Skycrest Dr Unit 7
- 1309 Skycrest Dr Unit 6
- 1309 Skycrest Dr Unit 5
- 1309 Skycrest Dr Unit 4
- 1501 Skycrest Dr Unit 4
- 1501 Skycrest Dr Unit 3
- 1501 Skycrest Dr Unit 2
- 1501 Skycrest Dr Unit 1
- 1441 Skycrest Dr Unit 4