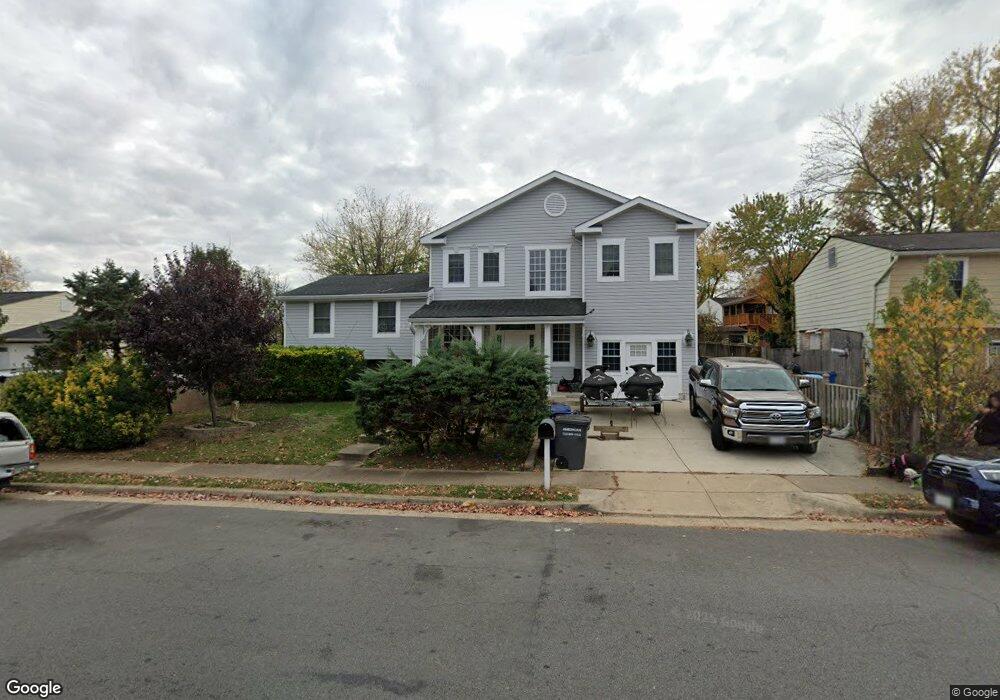
1302 E Beech Rd Sterling, VA 20164
Estimated Value: $728,612 - $828,000
3
Beds
5
Baths
3,170
Sq Ft
$242/Sq Ft
Est. Value
About This Home
This home is located at 1302 E Beech Rd, Sterling, VA 20164 and is currently estimated at $767,153, approximately $242 per square foot. 1302 E Beech Rd is a home located in Loudoun County with nearby schools including Sully Elementary School, Sterling Middle School, and Park View High School.
Ownership History
Date
Name
Owned For
Owner Type
Purchase Details
Closed on
Jul 2, 2020
Sold by
Orellana Marcelo and Orellana Nogales Charly
Bought by
Orellana Nogales Charly R
Current Estimated Value
Purchase Details
Closed on
Feb 4, 2016
Sold by
Orellana Marcelo and Orellana Charly R
Bought by
Orellana Beto O and Orellana Marcelo
Home Financials for this Owner
Home Financials are based on the most recent Mortgage that was taken out on this home.
Original Mortgage
$366,300
Outstanding Balance
$290,482
Interest Rate
3.79%
Mortgage Type
New Conventional
Estimated Equity
$476,671
Purchase Details
Closed on
Sep 24, 2001
Sold by
Bognar J
Bought by
Castellon Rolando and Orellana,Marcelo
Home Financials for this Owner
Home Financials are based on the most recent Mortgage that was taken out on this home.
Original Mortgage
$228,415
Interest Rate
6.98%
Create a Home Valuation Report for This Property
The Home Valuation Report is an in-depth analysis detailing your home's value as well as a comparison with similar homes in the area
Home Values in the Area
Average Home Value in this Area
Purchase History
| Date | Buyer | Sale Price | Title Company |
|---|---|---|---|
| Orellana Nogales Charly R | -- | None Available | |
| Orellana Beto O | -- | None Available | |
| Castellon Rolando | $232,000 | -- |
Source: Public Records
Mortgage History
| Date | Status | Borrower | Loan Amount |
|---|---|---|---|
| Open | Orellana Beto O | $366,300 | |
| Previous Owner | Castellon Rolando | $228,415 |
Source: Public Records
Tax History
| Year | Tax Paid | Tax Assessment Tax Assessment Total Assessment is a certain percentage of the fair market value that is determined by local assessors to be the total taxable value of land and additions on the property. | Land | Improvement |
|---|---|---|---|---|
| 2025 | $5,708 | $709,070 | $233,500 | $475,570 |
| 2024 | $5,550 | $641,590 | $208,500 | $433,090 |
| 2023 | $5,532 | $632,230 | $208,500 | $423,730 |
| 2022 | $5,286 | $593,980 | $188,500 | $405,480 |
| 2021 | $5,203 | $530,910 | $178,500 | $352,410 |
| 2020 | $5,617 | $542,750 | $153,500 | $389,250 |
| 2019 | $5,443 | $520,880 | $153,500 | $367,380 |
| 2018 | $5,188 | $478,120 | $138,500 | $339,620 |
| 2017 | $5,337 | $474,440 | $138,500 | $335,940 |
| 2016 | $5,397 | $471,380 | $0 | $0 |
| 2015 | $3,159 | $158,320 | $0 | $158,320 |
| 2014 | $3,114 | $149,650 | $0 | $149,650 |
Source: Public Records
Map
Nearby Homes
- 138 N Ithaca Ct
- 112 N Kennedy Rd
- 125 N Lincoln Ave
- 1314 E Holly Ave
- 221 N Emory Dr Unit 8
- 108 N Garfield Rd
- 308 E Cornell Dr
- 141 N Fillmore Ave Unit 10
- 121 N Fillmore Ave Unit 1
- 115 N Duke Dr
- 102 N Duke Dr
- 100 N Duke Dr Unit 269
- 204 Elizabeth Ct
- 133 N Baylor Dr Unit 97
- 301 N Alder Ave
- 709 N Belfort St
- 211 Amy Ct
- 1530 Powells Tavern Place
- 102 Evergreen St
- 175 Edinburgh Square
- 1304 E Beech Rd
- 139 N Harrison Rd
- 141 N Harrison Rd
- 1202 E Beech Rd
- 137 N Harrison Rd
- 143 N Harrison Rd
- 1301 E Beech Rd
- 1303 E Beech Rd
- 136 N Irving Rd
- 145 N Harrison Rd
- 1305 E Beech Rd
- 138 N Irving Rd
- 135 N Harrison Rd
- 1205 E Beech Rd
- 138 N Harrison Rd
- 136 N Harrison Rd
- 1307 E Beech Rd
- 302 Lillard Rd
- 1310 E Beech Rd
- 140 N Harrison Rd
Your Personal Tour Guide
Ask me questions while you tour the home.