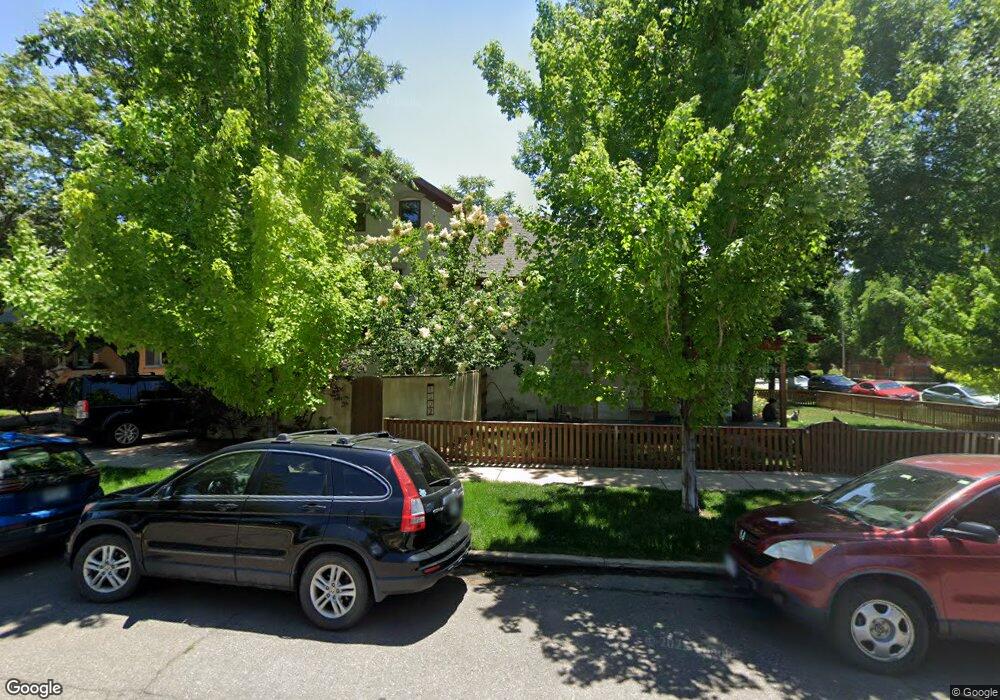
1302 Mapleton Ave Boulder, CO 80304
Whittier NeighborhoodEstimated Value: $2,748,659 - $4,496,000
5
Beds
4
Baths
3,987
Sq Ft
$868/Sq Ft
Est. Value
About This Home
This home is located at 1302 Mapleton Ave, Boulder, CO 80304 and is currently estimated at $3,461,915, approximately $868 per square foot. 1302 Mapleton Ave is a home located in Boulder County with nearby schools including Whittier Elementary School, Casey Middle School, and Boulder High School.
Ownership History
Date
Name
Owned For
Owner Type
Purchase Details
Closed on
Aug 14, 2020
Sold by
Mayer Pattrick Kelly
Bought by
Mayer Patrick Kelly and Jendrass Pamela
Current Estimated Value
Purchase Details
Closed on
Jul 25, 2011
Sold by
Juilland Jacques and King Willow A
Bought by
Mayer Patrick Kelly
Home Financials for this Owner
Home Financials are based on the most recent Mortgage that was taken out on this home.
Original Mortgage
$936,250
Outstanding Balance
$624,320
Interest Rate
3.87%
Mortgage Type
New Conventional
Estimated Equity
$2,837,595
Purchase Details
Closed on
Jul 7, 2005
Sold by
Podboy Whitney Jeremiah W and Podboy Whitney Kathleen
Bought by
Juilland Jacques
Home Financials for this Owner
Home Financials are based on the most recent Mortgage that was taken out on this home.
Original Mortgage
$359,650
Interest Rate
5.64%
Mortgage Type
Fannie Mae Freddie Mac
Purchase Details
Closed on
Apr 21, 1995
Sold by
Podboy Kathleen Augusta
Bought by
Whitney Kathleen Podboy
Purchase Details
Closed on
Dec 4, 1980
Bought by
Mayer Patrick Kelly
Create a Home Valuation Report for This Property
The Home Valuation Report is an in-depth analysis detailing your home's value as well as a comparison with similar homes in the area
Home Values in the Area
Average Home Value in this Area
Purchase History
| Date | Buyer | Sale Price | Title Company |
|---|---|---|---|
| Mayer Patrick Kelly | -- | None Available | |
| Mayer Patrick Kelly | $1,337,500 | Land Title Guarantee Company | |
| Juilland Jacques | $507,000 | -- | |
| Whitney Kathleen Podboy | -- | -- | |
| Mayer Patrick Kelly | $78,000 | -- |
Source: Public Records
Mortgage History
| Date | Status | Borrower | Loan Amount |
|---|---|---|---|
| Open | Mayer Patrick Kelly | $936,250 | |
| Previous Owner | Juilland Jacques | $359,650 |
Source: Public Records
Tax History
| Year | Tax Paid | Tax Assessment Tax Assessment Total Assessment is a certain percentage of the fair market value that is determined by local assessors to be the total taxable value of land and additions on the property. | Land | Improvement |
|---|---|---|---|---|
| 2025 | $19,880 | $208,631 | $59,781 | $148,850 |
| 2024 | $19,880 | $208,631 | $59,781 | $148,850 |
| 2023 | $19,533 | $225,314 | $62,953 | $166,046 |
| 2022 | $18,070 | $193,781 | $49,137 | $144,644 |
| 2021 | $17,235 | $199,356 | $50,551 | $148,805 |
| 2020 | $12,927 | $148,513 | $59,417 | $89,096 |
| 2019 | $12,730 | $148,513 | $59,417 | $89,096 |
| 2018 | $12,380 | $142,791 | $57,096 | $85,695 |
| 2017 | $11,993 | $157,863 | $63,123 | $94,740 |
| 2016 | $12,125 | $140,072 | $56,038 | $84,034 |
| 2015 | $11,482 | $112,642 | $51,262 | $61,380 |
| 2014 | $9,471 | $112,642 | $51,262 | $61,380 |
Source: Public Records
Map
Nearby Homes
- 1450 High St
- 2033 11th St Unit 3, 1
- 1111 Maxwell Ave Unit 109
- 1111 Maxwell Ave Unit 105
- 1526 Sunset Blvd
- 1360 Walnut St Unit 202
- 1360 Walnut St Unit 401
- 934 Spruce St
- 1709 Pine St Unit 3
- 1301 Canyon Blvd Unit 407
- 1155 Canyon Blvd Unit 202
- 1077 Canyon Blvd Unit 304
- 1077 Canyon Blvd Unit 305
- 1077 Canyon Blvd Unit 211
- 1009 Portland Place
- 1707 Walnut St Unit 203
- 1707 Walnut St Unit 209
- 1707 Walnut St Unit 307
- 1707 Walnut St Unit 208
- 1707 Walnut St Unit 308
- 2226 13th St
- 2305 13th St
- 2244 13th St
- 1305 Pine St
- 1319 Pine St
- 2319 13th St
- 1327 Pine St Unit 4
- 1327 Pine St Unit 3
- 1327 Pine St Unit 2
- 1327 Pine St Unit 1
- 1327 Pine St
- 2221 14th St Unit 3
- 2219 14th St Unit 2
- 2325 13th St
- 1333 Pine St Unit 5
- 1333 Pine St Unit 4
- 1333 Pine St Unit 3
- 1333 Pine St Unit 2
- 1333 Pine St Unit 1
- 1333 Pine St Unit 6
Your Personal Tour Guide
Ask me questions while you tour the home.