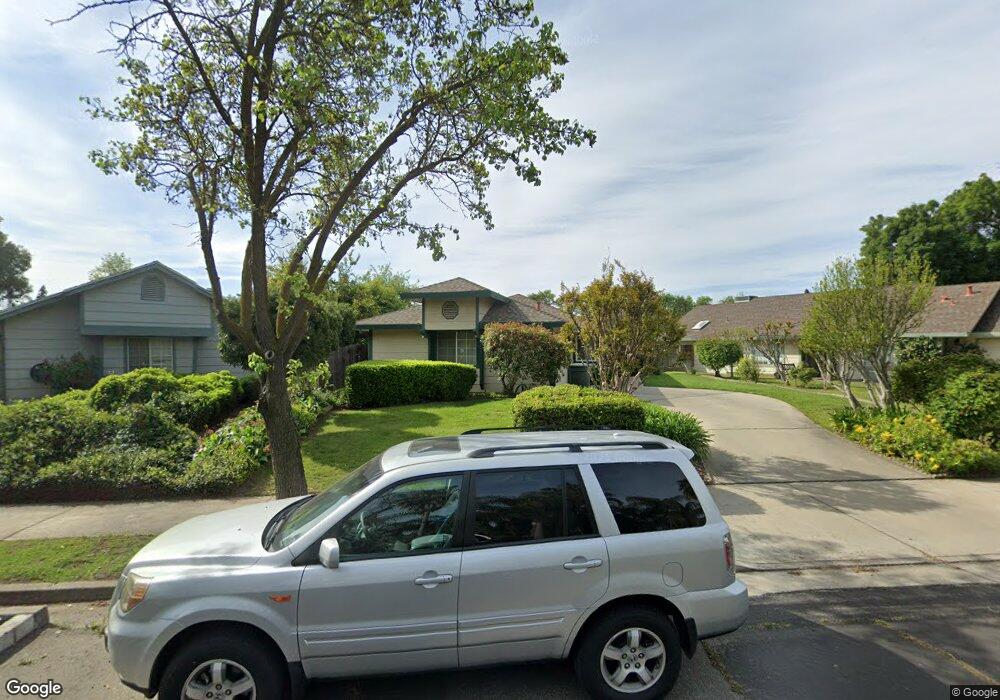
1304 Devonwood Dr Merced, CA 95348
North Merced NeighborhoodEstimated Value: $344,000 - $361,560
3
Beds
2
Baths
1,389
Sq Ft
$252/Sq Ft
Est. Value
About This Home
This home is located at 1304 Devonwood Dr, Merced, CA 95348 and is currently estimated at $349,390, approximately $251 per square foot. 1304 Devonwood Dr is a home located in Merced County with nearby schools including Luther Burbank Elementary School, Tenaya Middle School, and Merced High School.
Ownership History
Date
Name
Owned For
Owner Type
Purchase Details
Closed on
May 16, 2008
Sold by
Friedman Greg and Friedman Catherine M
Bought by
Friedman Gregory L and Friedman Catherine M
Current Estimated Value
Purchase Details
Closed on
Nov 11, 2002
Sold by
Norton Timothy Ward
Bought by
Friedman Greg and Friedman Catherine M
Home Financials for this Owner
Home Financials are based on the most recent Mortgage that was taken out on this home.
Original Mortgage
$121,550
Outstanding Balance
$50,425
Interest Rate
5.89%
Mortgage Type
Purchase Money Mortgage
Estimated Equity
$298,965
Purchase Details
Closed on
Mar 21, 2000
Sold by
Ward Norton Timothy
Bought by
Friedman Greg and Friedman Catherine M
Home Financials for this Owner
Home Financials are based on the most recent Mortgage that was taken out on this home.
Original Mortgage
$118,818
Interest Rate
8.24%
Mortgage Type
FHA
Purchase Details
Closed on
Feb 8, 1999
Sold by
Ward Norton Timothy
Bought by
Norton Laurie Kornegay
Create a Home Valuation Report for This Property
The Home Valuation Report is an in-depth analysis detailing your home's value as well as a comparison with similar homes in the area
Home Values in the Area
Average Home Value in this Area
Purchase History
| Date | Buyer | Sale Price | Title Company |
|---|---|---|---|
| Friedman Gregory L | -- | None Available | |
| Friedman Greg | -- | Fidelity Title Company | |
| Friedman Greg | $119,000 | Chicago Title Co | |
| Norton Laurie Kornegay | -- | Fidelity National Title Co |
Source: Public Records
Mortgage History
| Date | Status | Borrower | Loan Amount |
|---|---|---|---|
| Open | Friedman Greg | $121,550 | |
| Previous Owner | Friedman Greg | $118,818 |
Source: Public Records
Tax History
| Year | Tax Paid | Tax Assessment Tax Assessment Total Assessment is a certain percentage of the fair market value that is determined by local assessors to be the total taxable value of land and additions on the property. | Land | Improvement |
|---|---|---|---|---|
| 2025 | $1,855 | $182,874 | $46,096 | $136,778 |
| 2024 | $1,855 | $179,290 | $45,193 | $134,097 |
| 2023 | $1,827 | $175,775 | $44,307 | $131,468 |
| 2022 | $1,801 | $172,330 | $43,439 | $128,891 |
| 2021 | $1,796 | $168,952 | $42,588 | $126,364 |
| 2020 | $1,808 | $167,221 | $42,152 | $125,069 |
| 2019 | $1,780 | $163,943 | $41,326 | $122,617 |
| 2018 | $1,621 | $160,729 | $40,516 | $120,213 |
| 2017 | $1,681 | $157,578 | $39,722 | $117,856 |
| 2016 | $1,654 | $154,490 | $38,944 | $115,546 |
| 2015 | $1,626 | $152,171 | $38,360 | $113,811 |
| 2014 | $1,590 | $149,191 | $37,609 | $111,582 |
Source: Public Records
Map
Nearby Homes
- 1274 Devonwood Dr
- 1463 W 25th St
- 1312 W 24th St
- 1482 Autry Way
- 2525 R St
- 1061 Northwood Dr
- 1127 W 23rd St
- 1013 W Santa fe Ave
- 1145 W 22nd St
- 2988 Briarwood Ct
- 1020 W 24th St
- 1437 W North Bear Creek Dr
- 3157 Juneau Ct
- 1441 W 20th St
- 913 W Santa fe Ave
- 1375 Loughborough Dr
- 930 W 23rd St
- 2229 P St
- 944 W 22nd St
- 1541 W North Bear Creek Dr
- 1318 Devonwood Dr
- 1296 Devonwood Dr
- 1332 Devonwood Dr
- 1280 Devonwood Dr
- 1205 Devonwood Dr
- 1346 Devonwood Dr
- 1360 Devonwood Dr
- 1267 NW Bear Creek Dr
- 1267 W North Bear Creek Dr
- 1266 Devonwood Dr
- 1374 Devonwood Dr
- 2946 Meadows Ave
- 1243 W North Bear Creek Dr
- 1243 W North Bear Creek Dr
- 2952 Meadows Ave
- 2960 Meadows Ave
- 2916 Dogwood Ct
- 1388 Devonwood Dr
- 1229 W North Bear Creek Dr
- 2908 Dogwood Ct
Your Personal Tour Guide
Ask me questions while you tour the home.