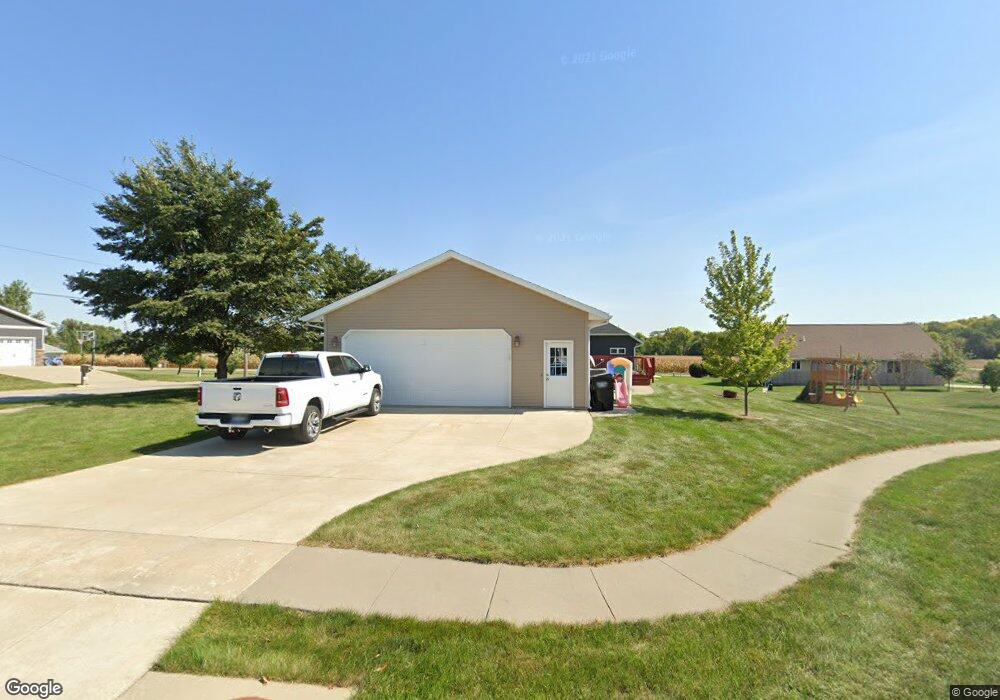
1304 E 16th St Vinton, IA 52349
Estimated Value: $298,934 - $330,000
5
Beds
4
Baths
1,446
Sq Ft
$216/Sq Ft
Est. Value
About This Home
This home is located at 1304 E 16th St, Vinton, IA 52349 and is currently estimated at $311,734, approximately $215 per square foot. 1304 E 16th St is a home located in Benton County with nearby schools including Tilford Elementary School, Shellsburg Elementary School, and Vinton-Shellsburg Middle School.
Ownership History
Date
Name
Owned For
Owner Type
Purchase Details
Closed on
Feb 28, 2014
Sold by
Cox Brennon Todd and Cox Beth
Bought by
Scott Lainie C and Scott Shane J
Current Estimated Value
Home Financials for this Owner
Home Financials are based on the most recent Mortgage that was taken out on this home.
Original Mortgage
$178,125
Outstanding Balance
$135,180
Interest Rate
4.45%
Mortgage Type
New Conventional
Estimated Equity
$176,554
Create a Home Valuation Report for This Property
The Home Valuation Report is an in-depth analysis detailing your home's value as well as a comparison with similar homes in the area
Home Values in the Area
Average Home Value in this Area
Purchase History
| Date | Buyer | Sale Price | Title Company |
|---|---|---|---|
| Scott Lainie C | $187,500 | None Available |
Source: Public Records
Mortgage History
| Date | Status | Borrower | Loan Amount |
|---|---|---|---|
| Open | Scott Lainie C | $178,125 |
Source: Public Records
Tax History Compared to Growth
Tax History
| Year | Tax Paid | Tax Assessment Tax Assessment Total Assessment is a certain percentage of the fair market value that is determined by local assessors to be the total taxable value of land and additions on the property. | Land | Improvement |
|---|---|---|---|---|
| 2025 | $4,468 | $267,500 | $40,700 | $226,800 |
| 2024 | $4,468 | $248,700 | $39,700 | $209,000 |
| 2023 | $4,216 | $248,700 | $39,700 | $209,000 |
| 2022 | $4,524 | $204,800 | $31,700 | $173,100 |
| 2021 | $4,524 | $204,800 | $31,700 | $173,100 |
| 2020 | $4,008 | $185,200 | $18,700 | $166,500 |
| 2019 | $4,008 | $185,200 | $18,700 | $166,500 |
| 2018 | $3,892 | $182,800 | $18,200 | $164,600 |
| 2017 | $3,746 | $182,800 | $18,200 | $164,600 |
| 2016 | $3,686 | $170,800 | $17,000 | $153,800 |
| 2015 | $3,686 | $170,800 | $17,000 | $153,800 |
| 2014 | $3,550 | $164,200 | $0 | $0 |
Source: Public Records
Map
Nearby Homes