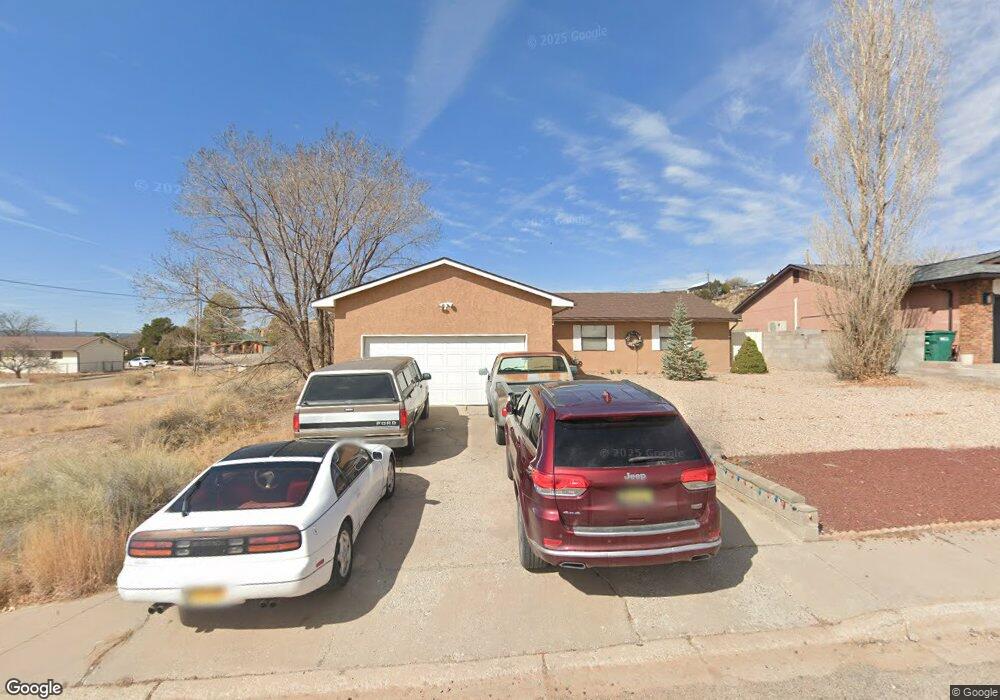
1305 N Third St Grants, NM 87020
Estimated Value: $197,000 - $244,000
3
Beds
2
Baths
--
Sq Ft
8,756
Sq Ft Lot
About This Home
This home is located at 1305 N Third St, Grants, NM 87020 and is currently estimated at $229,654. 1305 N Third St is a home located in Cibola County with nearby schools including Mount Taylor Elementary School, Los Alamitos Middle School, and Grants High School.
Ownership History
Date
Name
Owned For
Owner Type
Purchase Details
Closed on
Jun 29, 2012
Sold by
Mustin Constance
Bought by
Parrish Kevin D and Parrish Wendy R
Current Estimated Value
Home Financials for this Owner
Home Financials are based on the most recent Mortgage that was taken out on this home.
Original Mortgage
$141,391
Outstanding Balance
$96,215
Interest Rate
3.75%
Mortgage Type
FHA
Estimated Equity
$133,439
Purchase Details
Closed on
Nov 24, 2008
Sold by
Vigil Jeremy M and Vigil Christy R
Bought by
Mustin Gary L and Mustin Constance
Home Financials for this Owner
Home Financials are based on the most recent Mortgage that was taken out on this home.
Original Mortgage
$132,254
Interest Rate
5.98%
Mortgage Type
FHA
Purchase Details
Closed on
Jan 17, 2006
Sold by
Bodley Carl and Bodley Jacqueline
Bought by
Vigil Jeremy M and Vigil Christy R
Home Financials for this Owner
Home Financials are based on the most recent Mortgage that was taken out on this home.
Original Mortgage
$102,000
Interest Rate
6.25%
Mortgage Type
New Conventional
Create a Home Valuation Report for This Property
The Home Valuation Report is an in-depth analysis detailing your home's value as well as a comparison with similar homes in the area
Purchase History
| Date | Buyer | Sale Price | Title Company |
|---|---|---|---|
| Parrish Kevin D | -- | None Available | |
| Mustin Gary L | -- | None Available | |
| Vigil Jeremy M | -- | None Available |
Source: Public Records
Mortgage History
| Date | Status | Borrower | Loan Amount |
|---|---|---|---|
| Open | Parrish Kevin D | $141,391 | |
| Previous Owner | Mustin Gary L | $132,254 | |
| Previous Owner | Vigil Jeremy M | $102,000 |
Source: Public Records
Tax History
| Year | Tax Paid | Tax Assessment Tax Assessment Total Assessment is a certain percentage of the fair market value that is determined by local assessors to be the total taxable value of land and additions on the property. | Land | Improvement |
|---|---|---|---|---|
| 2025 | -- | $63,875 | $2,465 | $61,410 |
| 2024 | $2,068 | $62,015 | $2,393 | $59,622 |
| 2023 | $2,035 | $60,209 | $2,324 | $57,885 |
| 2022 | $2,055 | $58,455 | $2,256 | $56,199 |
| 2021 | $1,981 | $56,752 | $2,190 | $54,562 |
| 2020 | $1,947 | $56,752 | $2,190 | $54,562 |
| 2019 | $1,863 | $56,689 | $2,127 | $54,562 |
| 2018 | $1,884 | $55,038 | $2,055 | $52,983 |
| 2017 | $1,819 | $55,038 | $2,055 | $52,983 |
| 2016 | $1,726 | $54,978 | $1,995 | $52,983 |
| 2015 | $1,726 | $53,377 | $1,937 | $51,440 |
| 2014 | $1,718 | $51,825 | $1,883 | $49,942 |
| 2013 | $1,243 | $50,316 | $1,829 | $48,487 |
Source: Public Records
Map
Nearby Homes
- 1309 N Third St
- 1313 N Third St
- 1304 N Third St
- 1308 N Third St
- 1300 N Third St
- 1225 N Third St
- 1306 N Fourth St
- 1228 N Fourth St
- 1321 N Third St
- 1224 N Fourth St
- 1224 4th St
- 1300 N Fourth St
- 1320 N Third St
- 1225 N Fourth St
- 1305 N Second St
- 1309 N Second St
- 1301 N Second St
- 1301 N 2nd St
- 1220 N Fourth St
- 1313 N Second St
Your Personal Tour Guide
Ask me questions while you tour the home.