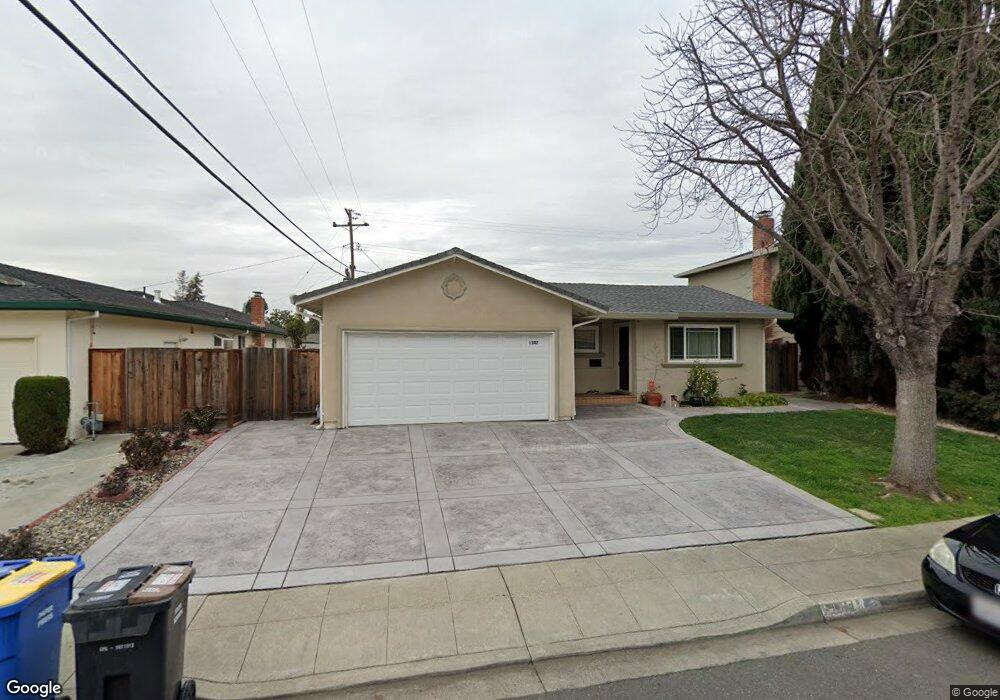
1307 Acadia Ave Milpitas, CA 95035
Estimated Value: $1,581,000 - $1,703,000
4
Beds
2
Baths
1,451
Sq Ft
$1,120/Sq Ft
Est. Value
About This Home
This home is located at 1307 Acadia Ave, Milpitas, CA 95035 and is currently estimated at $1,625,755, approximately $1,120 per square foot. 1307 Acadia Ave is a home located in Santa Clara County with nearby schools including Robert Randall Elementary School, Alexander Rose Elementary School, and Rancho Milpitas Middle School.
Ownership History
Date
Name
Owned For
Owner Type
Purchase Details
Closed on
Aug 9, 2002
Sold by
Tran Victor and Vu Thom
Bought by
Tran Victor and Vu Thom
Current Estimated Value
Home Financials for this Owner
Home Financials are based on the most recent Mortgage that was taken out on this home.
Original Mortgage
$372,000
Outstanding Balance
$148,377
Interest Rate
5.75%
Estimated Equity
$1,477,378
Purchase Details
Closed on
Dec 7, 2001
Sold by
Khangura Joga S and Khangura Balwinder K
Bought by
Tran Victor and Vu Thom
Home Financials for this Owner
Home Financials are based on the most recent Mortgage that was taken out on this home.
Original Mortgage
$335,200
Interest Rate
6.57%
Purchase Details
Closed on
Jul 3, 1998
Sold by
Khangura Avtar S and Khangura Navtej K
Bought by
Khangura Joga S and Khangura Balwinder K
Purchase Details
Closed on
Oct 24, 1995
Sold by
Khangura Avtar S and Khangura Navtej
Bought by
Khangura Joga S and Khangura Balwinder K
Create a Home Valuation Report for This Property
The Home Valuation Report is an in-depth analysis detailing your home's value as well as a comparison with similar homes in the area
Home Values in the Area
Average Home Value in this Area
Purchase History
| Date | Buyer | Sale Price | Title Company |
|---|---|---|---|
| Tran Victor | $186,000 | Alliance Title Company | |
| Tran Victor | $419,000 | Chicago Title Co | |
| Khangura Joga S | -- | -- | |
| Khangura Joga S | -- | -- |
Source: Public Records
Mortgage History
| Date | Status | Borrower | Loan Amount |
|---|---|---|---|
| Open | Tran Victor | $372,000 | |
| Closed | Tran Victor | $335,200 | |
| Closed | Tran Victor | $41,900 |
Source: Public Records
Tax History Compared to Growth
Tax History
| Year | Tax Paid | Tax Assessment Tax Assessment Total Assessment is a certain percentage of the fair market value that is determined by local assessors to be the total taxable value of land and additions on the property. | Land | Improvement |
|---|---|---|---|---|
| 2025 | $7,469 | $649,634 | $268,540 | $381,094 |
| 2024 | $7,469 | $636,897 | $263,275 | $373,622 |
| 2023 | $7,444 | $624,410 | $258,113 | $366,297 |
| 2022 | $7,414 | $612,167 | $253,052 | $359,115 |
| 2021 | $7,305 | $600,165 | $248,091 | $352,074 |
| 2020 | $7,178 | $594,012 | $245,548 | $348,464 |
| 2019 | $7,096 | $582,366 | $240,734 | $341,632 |
| 2018 | $6,740 | $570,948 | $236,014 | $334,934 |
| 2017 | $6,652 | $559,754 | $231,387 | $328,367 |
| 2016 | $6,382 | $548,779 | $226,850 | $321,929 |
| 2015 | $6,316 | $540,537 | $223,443 | $317,094 |
| 2014 | $6,142 | $529,950 | $219,067 | $310,883 |
Source: Public Records
Map
Nearby Homes
- 1209 Glacier Dr
- 484 Dempsey Rd Unit 185
- 496 Dempsey Rd Unit 199
- 1501 Canton Dr
- 1536 Sonoma Dr
- 1612 Tahoe Dr
- 1710 Clear Lake Ave
- 2113 Uridias Ranch Rd
- 17 Terfidia Ln
- 253 Park Hill Dr
- 3139 Laneview Dr
- 861 Garden St
- 2327 Farmcrest St
- 813 Garden St
- 3352 Landess Ave Unit D
- 1455 Cherry Cir
- 2085 Ashwood Ln
- 1421 Nightshade Rd Unit 31
- 1435 Nightshade Rd Unit 40
- 1452 Nightshade Rd Unit 40
- 1317 Acadia Ave
- 1295 Acadia Ave
- 1296 Yosemite Dr
- 1327 Acadia Ave
- 1308 Yosemite Dr
- 1286 Yosemite Dr
- 1312 Acadia Ave
- 1318 Yosemite Dr
- 1322 Acadia Ave
- 1302 Acadia Ave
- 1337 Acadia Ave
- 1332 Acadia Ave
- 1328 Yosemite Dr
- 1342 Acadia Ave
- 1347 Acadia Ave
- 1281 Acadia Ave
- 1273 Acadia Ave
- 1319 Glacier Dr
- 1338 Yosemite Dr
- 1329 Glacier Dr