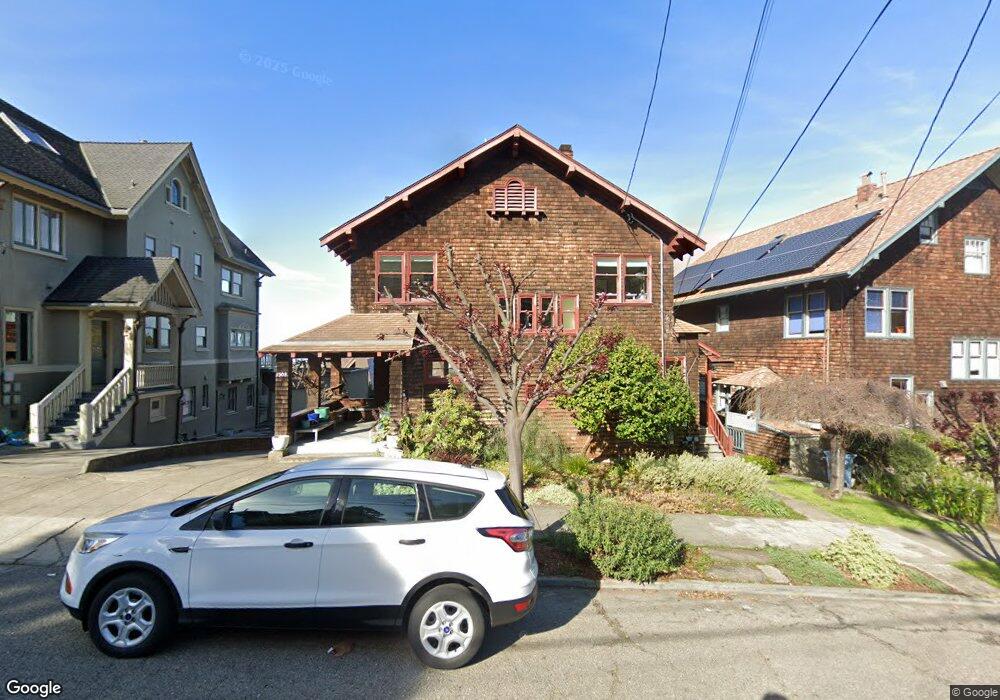
1308 Arch St Berkeley, CA 94708
Berkeley Hills NeighborhoodEstimated Value: $1,624,000 - $2,021,000
5
Beds
4
Baths
2,432
Sq Ft
$739/Sq Ft
Est. Value
About This Home
This home is located at 1308 Arch St, Berkeley, CA 94708 and is currently estimated at $1,797,466, approximately $739 per square foot. 1308 Arch St is a home located in Alameda County with nearby schools including Berkeley Arts Magnet at Whittier School, Cragmont Elementary School, and Washington Elementary School.
Ownership History
Date
Name
Owned For
Owner Type
Purchase Details
Closed on
Mar 8, 2017
Sold by
Craig Ruth and Craig Walter
Bought by
1308 Arch St Llc
Current Estimated Value
Purchase Details
Closed on
May 12, 1998
Sold by
Craig Julia
Bought by
Craig Julia and The Julia Craig Trust
Purchase Details
Closed on
Apr 14, 1998
Sold by
Craig Sarah and William Craig Trust
Bought by
Craig Ruth and Craig Walter
Purchase Details
Closed on
Apr 7, 1998
Sold by
Craig William
Bought by
Craig William and Craig Julia
Create a Home Valuation Report for This Property
The Home Valuation Report is an in-depth analysis detailing your home's value as well as a comparison with similar homes in the area
Home Values in the Area
Average Home Value in this Area
Purchase History
| Date | Buyer | Sale Price | Title Company |
|---|---|---|---|
| 1308 Arch St Llc | -- | None Available | |
| Craig Julia | -- | -- | |
| Craig Ruth | -- | None Available | |
| Craig William | -- | -- | |
| Craig William | -- | -- |
Source: Public Records
Tax History
| Year | Tax Paid | Tax Assessment Tax Assessment Total Assessment is a certain percentage of the fair market value that is determined by local assessors to be the total taxable value of land and additions on the property. | Land | Improvement |
|---|---|---|---|---|
| 2025 | $8,759 | $149,553 | $92,920 | $56,633 |
| 2024 | $8,759 | $146,621 | $91,098 | $55,523 |
| 2023 | $8,119 | $143,746 | $89,312 | $54,434 |
| 2022 | $8,882 | $140,928 | $87,561 | $53,367 |
| 2021 | $10,224 | $138,164 | $85,844 | $52,320 |
| 2020 | $6,988 | $136,748 | $84,964 | $51,784 |
| 2019 | $6,356 | $134,067 | $83,298 | $50,769 |
| 2018 | $6,157 | $131,439 | $81,665 | $49,774 |
| 2017 | $5,834 | $128,862 | $80,064 | $48,798 |
| 2016 | $5,392 | $126,335 | $78,494 | $47,841 |
| 2015 | $5,273 | $124,437 | $77,315 | $47,122 |
| 2014 | $5,078 | $122,000 | $75,801 | $46,199 |
Source: Public Records
Map
Nearby Homes
- 1471 Scenic Ave
- 1440 Walnut St Unit 5
- 1444 Walnut St
- 2012 Rose St
- 1136 Keith Ave
- 2201 Virginia St Unit 2
- 2340 Virginia St
- 1106 Cragmont Ave
- 1425 Martin Luther King jr Way
- 2600 Hilgard Ave
- 2451 Le Conte Ave
- 1165 Cragmont Ave
- 1610 Milvia St
- 1609 Bonita Ave Unit 3
- 1609 Bonita Ave Unit 5
- 2634 Virginia St Unit 13
- 1110 Sterling Ave
- 1024 Miller Ave
- 2700 Le Conte Ave Unit 301
- 2700 Le Conte Ave Unit 402
Your Personal Tour Guide
Ask me questions while you tour the home.