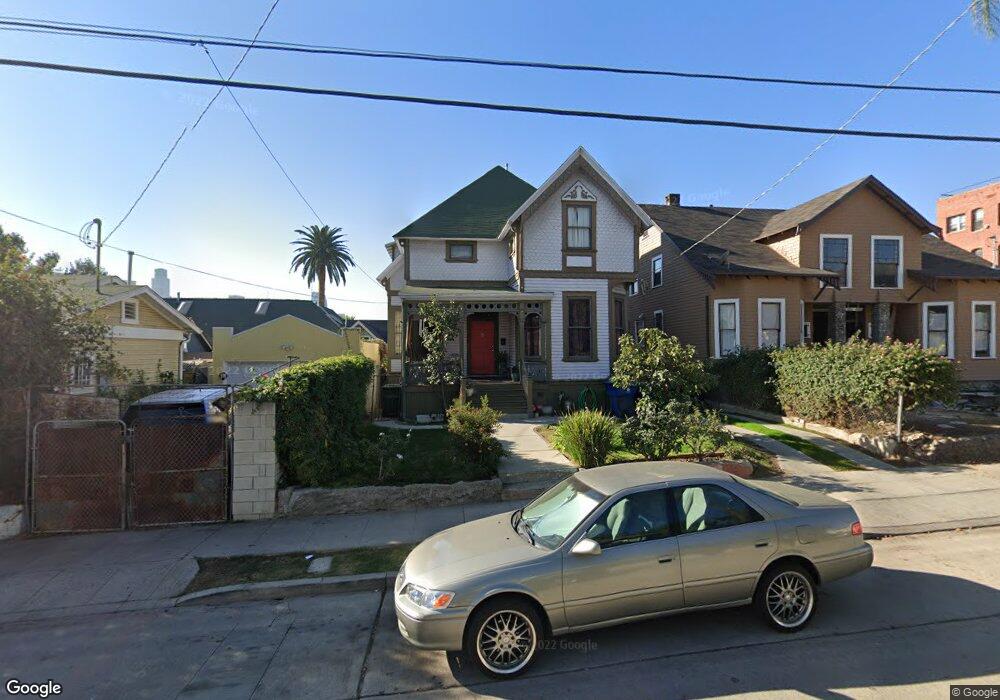
1308 Calumet Ave Los Angeles, CA 90026
Echo Park NeighborhoodEstimated Value: $1,485,380 - $2,042,000
4
Beds
3
Baths
3,203
Sq Ft
$522/Sq Ft
Est. Value
About This Home
This home is located at 1308 Calumet Ave, Los Angeles, CA 90026 and is currently estimated at $1,670,845, approximately $521 per square foot. 1308 Calumet Ave is a home located in Los Angeles County with nearby schools including Betty Plasencia Elementary School, Sal Castro Middle School, and Ramón C. Cortines School of Visual and Performing Arts.
Ownership History
Date
Name
Owned For
Owner Type
Purchase Details
Closed on
Oct 11, 2017
Sold by
Burnet Donald Bruce
Bought by
Burnet Leslie Anne
Current Estimated Value
Home Financials for this Owner
Home Financials are based on the most recent Mortgage that was taken out on this home.
Original Mortgage
$200,000
Outstanding Balance
$166,877
Interest Rate
3.78%
Mortgage Type
Credit Line Revolving
Estimated Equity
$1,503,968
Purchase Details
Closed on
Sep 14, 2007
Sold by
Denny Leslie Anne
Bought by
Burnet Leslie Anne
Purchase Details
Closed on
Oct 27, 1998
Sold by
California Community Foundation
Bought by
Denny Leslie Anne
Home Financials for this Owner
Home Financials are based on the most recent Mortgage that was taken out on this home.
Original Mortgage
$153,900
Interest Rate
6.6%
Purchase Details
Closed on
Aug 3, 1998
Sold by
Klein Robert A
Bought by
California Community Foundation
Create a Home Valuation Report for This Property
The Home Valuation Report is an in-depth analysis detailing your home's value as well as a comparison with similar homes in the area
Home Values in the Area
Average Home Value in this Area
Purchase History
| Date | Buyer | Sale Price | Title Company |
|---|---|---|---|
| Burnet Leslie Anne | -- | Fidelity National Title | |
| Burnet Leslie Anne | -- | None Available | |
| Denny Leslie Anne | $171,000 | First American Title Co | |
| California Community Foundation | -- | First American Title Co |
Source: Public Records
Mortgage History
| Date | Status | Borrower | Loan Amount |
|---|---|---|---|
| Open | Burnet Leslie Anne | $200,000 | |
| Previous Owner | Denny Leslie Anne | $153,900 |
Source: Public Records
Tax History Compared to Growth
Tax History
| Year | Tax Paid | Tax Assessment Tax Assessment Total Assessment is a certain percentage of the fair market value that is determined by local assessors to be the total taxable value of land and additions on the property. | Land | Improvement |
|---|---|---|---|---|
| 2025 | $3,399 | $268,051 | $214,765 | $53,286 |
| 2024 | $3,399 | $262,796 | $210,554 | $52,242 |
| 2023 | $3,337 | $257,644 | $206,426 | $51,218 |
| 2022 | $3,185 | $252,593 | $202,379 | $50,214 |
| 2021 | $3,127 | $247,641 | $198,411 | $49,230 |
| 2019 | $3,033 | $240,298 | $192,527 | $47,771 |
| 2018 | $2,986 | $235,587 | $188,752 | $46,835 |
| 2017 | $2,920 | $230,968 | $185,051 | $45,917 |
| 2016 | $2,816 | $226,440 | $181,423 | $45,017 |
| 2015 | $2,776 | $223,039 | $178,698 | $44,341 |
| 2014 | $2,790 | $218,671 | $175,198 | $43,473 |
Source: Public Records
Map
Nearby Homes
- 942 E Edgeware Rd
- 1340 Carroll Ave
- 1400 Carroll Ave
- 1432 Kellam Ave
- 1236 W Sunset Blvd
- 1120 W Edgeware Rd
- 341 Douglas St
- 1133 Sunvue Place
- 340 Firmin St
- 955 1/2 Everett St
- 1471 Wallace Ave
- 1111 Sunvue Place
- 647 Laveta Terrace
- 908 Everett St
- 830 E Kensington Rd Unit 3
- 1415 W Court St
- 843 Laveta Terrace
- 940 Marview Ave
- 932 W Kensington Rd
- 1201 Douglas St
- 1314 Calumet Ave
- 607 E Edgeware Rd
- 613 E Edgeware Rd
- 605 E Edgeware Rd
- 1320 Calumet Ave
- 601 E Edgeware Rd
- 1311 Bellevue Ave
- 701 E Edgeware Rd
- 1321 Bellevue Ave
- 1324 Calumet Ave Unit 105A
- 1324 Calumet Ave Unit 103A
- 1324 Calumet Ave
- 705 E Edgeware Rd
- 1315 Calumet Ave
- 1325 Bellevue Ave
- 1330 Calumet Ave
- 600 E Edgeware Rd
- 1329 Bellevue Ave
- 1325 Calumet Ave
- 608 E Edgeware Rd