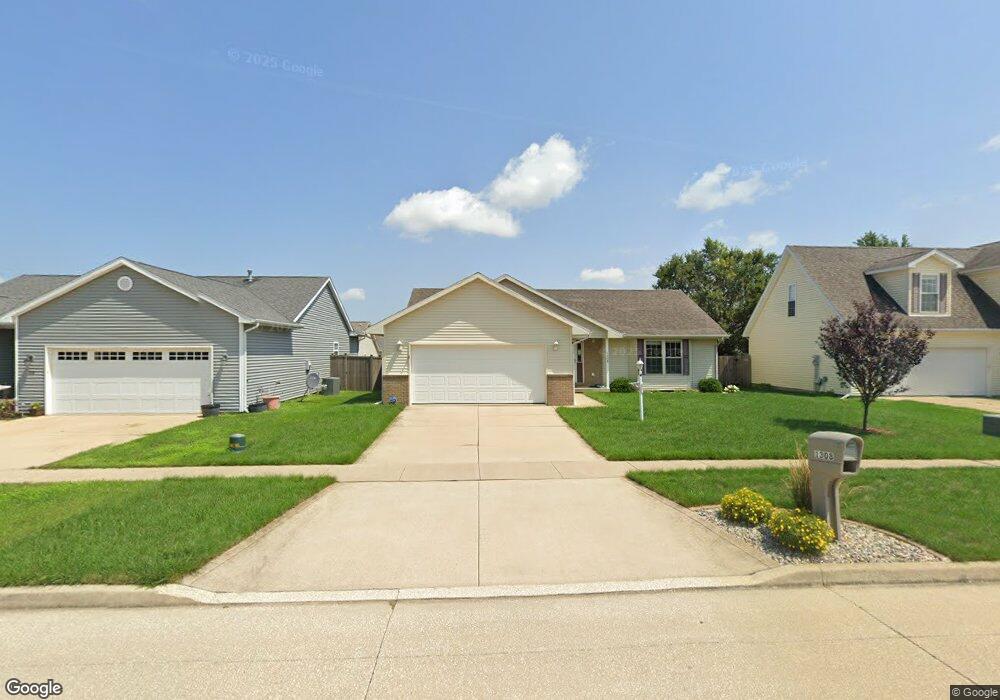
1308 Farley Ln Champaign, IL 61822
Boulder Ridge NeighborhoodEstimated Value: $252,000 - $322,000
Studio
--
Bath
--
Sq Ft
6,665
Sq Ft Lot
About This Home
This home is located at 1308 Farley Ln, Champaign, IL 61822 and is currently estimated at $284,825. 1308 Farley Ln is a home located in Champaign County with nearby schools including Centennial High School, Swann Special Care Center-Elem/Secondary School, and Countryside School.
Ownership History
Date
Name
Owned For
Owner Type
Purchase Details
Closed on
May 11, 2011
Sold by
Wong Chung L and Wong Maria S
Bought by
Heath Andrew C
Current Estimated Value
Home Financials for this Owner
Home Financials are based on the most recent Mortgage that was taken out on this home.
Original Mortgage
$125,200
Interest Rate
3.9%
Mortgage Type
New Conventional
Purchase Details
Closed on
Jun 17, 2005
Sold by
Harris Maron Keith
Bought by
Wong Chung L and Wong Maria S
Home Financials for this Owner
Home Financials are based on the most recent Mortgage that was taken out on this home.
Original Mortgage
$100,000
Interest Rate
5.39%
Mortgage Type
Fannie Mae Freddie Mac
Purchase Details
Closed on
Feb 8, 2005
Sold by
C & C Illinois Properties Llc
Bought by
Harris Maron K
Home Financials for this Owner
Home Financials are based on the most recent Mortgage that was taken out on this home.
Original Mortgage
$124,000
Interest Rate
6.5%
Mortgage Type
Construction
Create a Home Valuation Report for This Property
The Home Valuation Report is an in-depth analysis detailing your home's value as well as a comparison with similar homes in the area
Home Values in the Area
Average Home Value in this Area
Purchase History
| Date | Buyer | Sale Price | Title Company |
|---|---|---|---|
| Heath Andrew C | $156,500 | None Available | |
| Wong Chung L | $162,000 | -- | |
| Harris Maron K | $35,000 | Act |
Source: Public Records
Mortgage History
| Date | Status | Borrower | Loan Amount |
|---|---|---|---|
| Previous Owner | Heath Andrew C | $125,200 | |
| Previous Owner | Wong Chung L | $100,000 | |
| Previous Owner | Harris Maron K | $124,000 |
Source: Public Records
Tax History
| Year | Tax Paid | Tax Assessment Tax Assessment Total Assessment is a certain percentage of the fair market value that is determined by local assessors to be the total taxable value of land and additions on the property. | Land | Improvement |
|---|---|---|---|---|
| 2024 | $5,043 | $67,990 | $15,860 | $52,130 |
| 2023 | $5,043 | $61,920 | $14,440 | $47,480 |
| 2022 | $4,701 | $57,120 | $13,320 | $43,800 |
| 2021 | $4,577 | $56,000 | $13,060 | $42,940 |
| 2020 | $4,387 | $53,850 | $12,560 | $41,290 |
| 2019 | $4,235 | $52,740 | $12,300 | $40,440 |
| 2018 | $4,131 | $51,910 | $12,110 | $39,800 |
| 2017 | $3,968 | $49,910 | $11,640 | $38,270 |
| 2016 | $3,547 | $48,880 | $11,400 | $37,480 |
| 2015 | $3,565 | $48,020 | $11,200 | $36,820 |
| 2014 | $3,397 | $48,020 | $11,200 | $36,820 |
| 2013 | $3,369 | $48,020 | $11,200 | $36,820 |
Source: Public Records
Map
Nearby Homes
- 1328 W Ridge Ln
- 1407 Sand Dollar Dr
- 1409 Sand Dollar Dr
- 1413 Sand Dollar Dr
- 6 lots Boulder Ridge Dr
- 3712 Lighthouse Pointe
- 3710 Lighthouse Pointe
- 3810 Obsidian Dr
- 3724 Summer Sage Ct
- 4011 Tallgrass Dr
- 621 Sedgegrass Dr
- 709 Erin Dr
- 3420 Stoneway Ct
- 610 Sedgegrass Dr
- 1504 Greyrock Ln
- 616 Erin Dr
- 1003 Cyndy Ct
- 3103 Timberline Dr
- 1108 Kara Dr
- 3913 Jade Dr
- 1310 Farley Ln
- 1306 Farley Ln
- 1307 Peppermill Ln
- 1305 Peppermill Ln
- 1312 Farley Ln
- 1304 Farley Ln
- 1309 Peppermill Ln
- 1303 Peppermill Ln
- 1309 Farley Ln
- 1311 Peppermill Ln
- 1314 Farley Ln
- 1305 Farley Ln
- 1311 Farley Ln
- 1302 Farley Ln
- 4002 Pebblebrook Ln
- 1303 Farley Ln
- 1313 Peppermill Ln
- 1330 W Ridge Ln
- 1402 Farley Ln
- 3925 Rockdale Dr
Your Personal Tour Guide
Ask me questions while you tour the home.