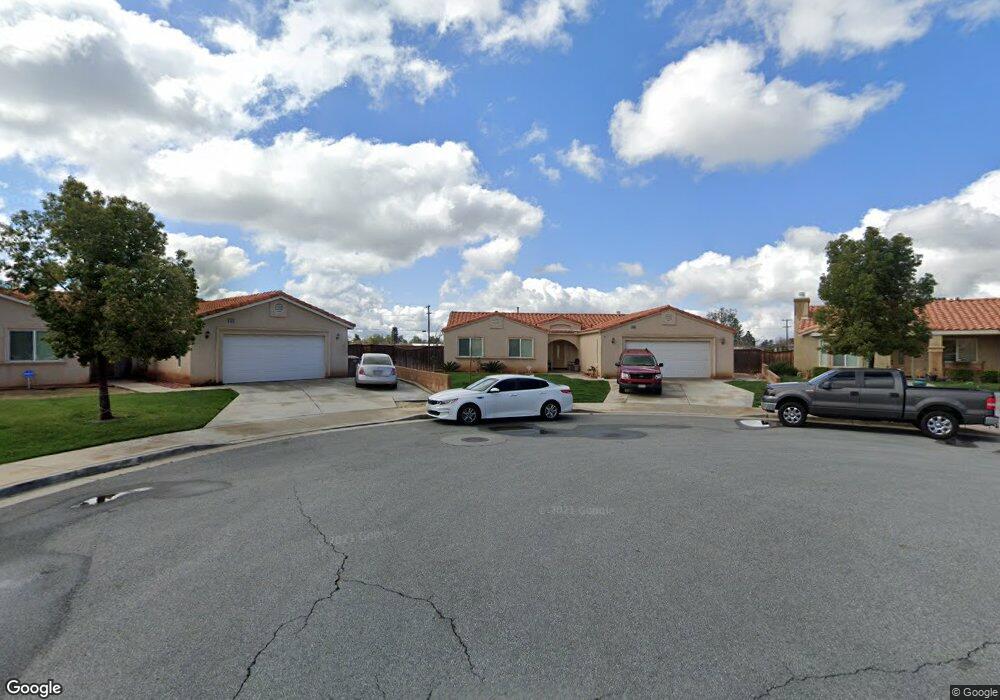
1309 Kylie Ct Beaumont, CA 92223
Estimated Value: $483,000 - $500,000
4
Beds
2
Baths
1,570
Sq Ft
$313/Sq Ft
Est. Value
About This Home
This home is located at 1309 Kylie Ct, Beaumont, CA 92223 and is currently estimated at $491,383, approximately $312 per square foot. 1309 Kylie Ct is a home located in Riverside County with nearby schools including Palm Innovation Academy, San Gorgonio Middle School, and Beaumont Senior High School.
Ownership History
Date
Name
Owned For
Owner Type
Purchase Details
Closed on
Jun 8, 2011
Sold by
C & C Properties
Bought by
Deleon Jose L and Deleon Maria G
Current Estimated Value
Home Financials for this Owner
Home Financials are based on the most recent Mortgage that was taken out on this home.
Original Mortgage
$170,896
Outstanding Balance
$117,091
Interest Rate
4.5%
Mortgage Type
VA
Estimated Equity
$374,292
Purchase Details
Closed on
May 3, 2011
Sold by
Zamora Peter and Zamora Teresa
Bought by
C & C Properties
Home Financials for this Owner
Home Financials are based on the most recent Mortgage that was taken out on this home.
Original Mortgage
$170,896
Outstanding Balance
$117,091
Interest Rate
4.5%
Mortgage Type
VA
Estimated Equity
$374,292
Purchase Details
Closed on
Mar 17, 2006
Sold by
Beaumont Enterprises 19-1 Llc
Bought by
Zamora Peter and Zamora Teresa
Home Financials for this Owner
Home Financials are based on the most recent Mortgage that was taken out on this home.
Original Mortgage
$263,960
Interest Rate
6.76%
Mortgage Type
Purchase Money Mortgage
Create a Home Valuation Report for This Property
The Home Valuation Report is an in-depth analysis detailing your home's value as well as a comparison with similar homes in the area
Home Values in the Area
Average Home Value in this Area
Purchase History
| Date | Buyer | Sale Price | Title Company |
|---|---|---|---|
| Deleon Jose L | $167,500 | Nations Title Company | |
| C & C Properties | $123,300 | None Available | |
| Zamora Peter | $330,000 | Stewart Title Riverside |
Source: Public Records
Mortgage History
| Date | Status | Borrower | Loan Amount |
|---|---|---|---|
| Open | Deleon Jose L | $170,896 | |
| Previous Owner | Zamora Peter | $263,960 |
Source: Public Records
Tax History Compared to Growth
Tax History
| Year | Tax Paid | Tax Assessment Tax Assessment Total Assessment is a certain percentage of the fair market value that is determined by local assessors to be the total taxable value of land and additions on the property. | Land | Improvement |
|---|---|---|---|---|
| 2025 | $2,736 | $210,123 | $37,674 | $172,449 |
| 2023 | $2,736 | $201,965 | $36,212 | $165,753 |
| 2022 | $2,695 | $198,005 | $35,502 | $162,503 |
| 2021 | $2,644 | $194,123 | $34,806 | $159,317 |
| 2020 | $2,616 | $192,134 | $34,450 | $157,684 |
| 2019 | $2,575 | $188,368 | $33,775 | $154,593 |
| 2018 | $2,565 | $184,675 | $33,114 | $151,561 |
| 2017 | $2,524 | $181,055 | $32,465 | $148,590 |
| 2016 | $2,458 | $177,506 | $31,829 | $145,677 |
| 2015 | $2,418 | $174,841 | $31,351 | $143,490 |
| 2014 | $2,419 | $171,418 | $30,738 | $140,680 |
Source: Public Records
Map
Nearby Homes
- 1216 Beaumont Ave
- 1385 Palm Ave
- 1292 N California Ave
- 1168 Palm Ave
- 1141 Palm Ave
- 274 W 12th St
- 322 E 11th St
- 1127 Edgar Ave
- 687 Cedar View Dr
- 973 Orange Ave
- 1425 Cherry Ave
- 0 Edgar Ave Unit HD24231259
- 1160 Pennsylvania Ave
- 1595 Mountain View Trail
- 850 Beaumont Ave
- 890 N California Ave
- 1172 Cedar Hollow Rd
- 874 Palm Ave
- 1318 Burdock St Unit 36
- 1601 Stone Creek Rd