Estimated Value: $355,000 - $487,000
3
Beds
2
Baths
1,208
Sq Ft
$332/Sq Ft
Est. Value
About This Home
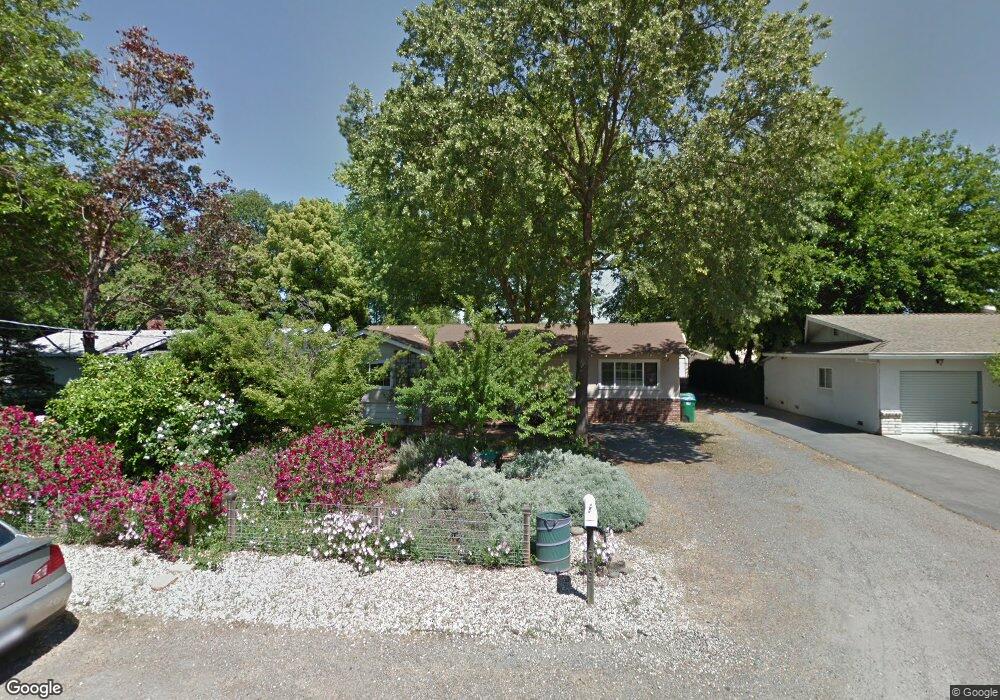
This home is located at 1309 Orchard Way, Chico, CA 95928 and is currently estimated at $401,008, approximately $331 per square foot. 1309 Orchard Way is a home located in Butte County with nearby schools including Chapman Elementary School, Chico Junior High School, and Chico High School.
Ownership History
Date
Name
Owned For
Owner Type
Purchase Details
Closed on
Jun 15, 2020
Sold by
Vidal Sue Anne
Bought by
Vidal Sue A and The Sue A Vidal 2020 Revocable
Current Estimated Value
Purchase Details
Closed on
May 26, 2010
Sold by
Hill Geoffrey Christopher and Hopewell Jillian Leslie
Bought by
Vidal Sue Anne
Home Financials for this Owner
Home Financials are based on the most recent Mortgage that was taken out on this home.
Original Mortgage
$255,558
Outstanding Balance
$173,611
Interest Rate
5.25%
Mortgage Type
FHA
Estimated Equity
$227,397
Purchase Details
Closed on
Nov 1, 2002
Sold by
Gallagher Jean K
Bought by
Hill Geoffrey Christopher and Hopewell Jillian Leslie
Home Financials for this Owner
Home Financials are based on the most recent Mortgage that was taken out on this home.
Original Mortgage
$175,920
Interest Rate
5.88%
Purchase Details
Closed on
Mar 13, 2002
Sold by
Lewis James Angevine
Bought by
Gallagher Jean K
Create a Home Valuation Report for This Property
The Home Valuation Report is an in-depth analysis detailing your home's value as well as a comparison with similar homes in the area
Purchase History
| Date | Buyer | Sale Price | Title Company |
|---|---|---|---|
| Vidal Sue A | -- | None Available | |
| Vidal Sue Anne | $259,000 | Mid Valley Title & Escrow Co | |
| Hill Geoffrey Christopher | $220,000 | Bidwell Title & Escrow Co | |
| Gallagher Jean K | -- | -- |
Source: Public Records
Mortgage History
| Date | Status | Borrower | Loan Amount |
|---|---|---|---|
| Open | Vidal Sue Anne | $255,558 | |
| Previous Owner | Hill Geoffrey Christopher | $175,920 | |
| Closed | Hill Geoffrey Christopher | $21,900 |
Source: Public Records
Tax History
| Year | Tax Paid | Tax Assessment Tax Assessment Total Assessment is a certain percentage of the fair market value that is determined by local assessors to be the total taxable value of land and additions on the property. | Land | Improvement |
|---|---|---|---|---|
| 2025 | $3,567 | $334,307 | $129,073 | $205,234 |
| 2024 | $3,567 | $327,753 | $126,543 | $201,210 |
| 2023 | $3,524 | $321,327 | $124,062 | $197,265 |
| 2022 | $3,466 | $315,028 | $121,630 | $193,398 |
| 2021 | $3,397 | $308,852 | $119,246 | $189,606 |
| 2020 | $3,388 | $305,686 | $118,024 | $187,662 |
| 2019 | $3,326 | $299,693 | $115,710 | $183,983 |
| 2018 | $3,260 | $293,818 | $113,442 | $180,376 |
| 2017 | $3,194 | $288,058 | $111,218 | $176,840 |
| 2016 | $2,670 | $259,000 | $125,000 | $134,000 |
| 2015 | $2,646 | $253,000 | $125,000 | $128,000 |
| 2014 | $2,551 | $245,000 | $125,000 | $120,000 |
Source: Public Records
Map
Nearby Homes
- 1022 Poppy St
- 1012 Poppy St
- 1401 Pomona Ln
- 951 Walnut St
- 1901 Dayton Rd Unit 2
- 1901 Dayton Rd Unit 176
- 1901 Dayton Rd Unit 6
- 1901 Dayton Rd Unit 100
- 1901 Dayton Rd Unit 170
- 2460 Estes Rd
- 1318 Salem St
- 1631 Salem St
- 1731 Salem St
- 0 W 7th St
- 1608 Broadway St
- 1157 Broadway St
- 1128 W 5th St
- 1029 Salem St
- 1001 Salem St
- 403 Ash St
- 1317 Orchard Way
- 1301 Orchard Way
- 1281 Orchard Way
- 1325 Orchard Way
- 1277 Orchard Way Unit 35
- 1277 Orchard Way
- 1335 Orchard Way
- 1276 Orchard Way
- 1271 Orchard Way
- 1308 Orchard Way
- 1300 Orchard Way
- 1318 Orchard Way
- 1280 Orchard Way
- 1330 Orchard Way
- 1267 Orchard Way
- 1272 Orchard Way
- 1341 Orchard Way
- 1266 Orchard Way
- 1260 Orchard Way
- 1332 Orchard Way
Your Personal Tour Guide
Ask me questions while you tour the home.