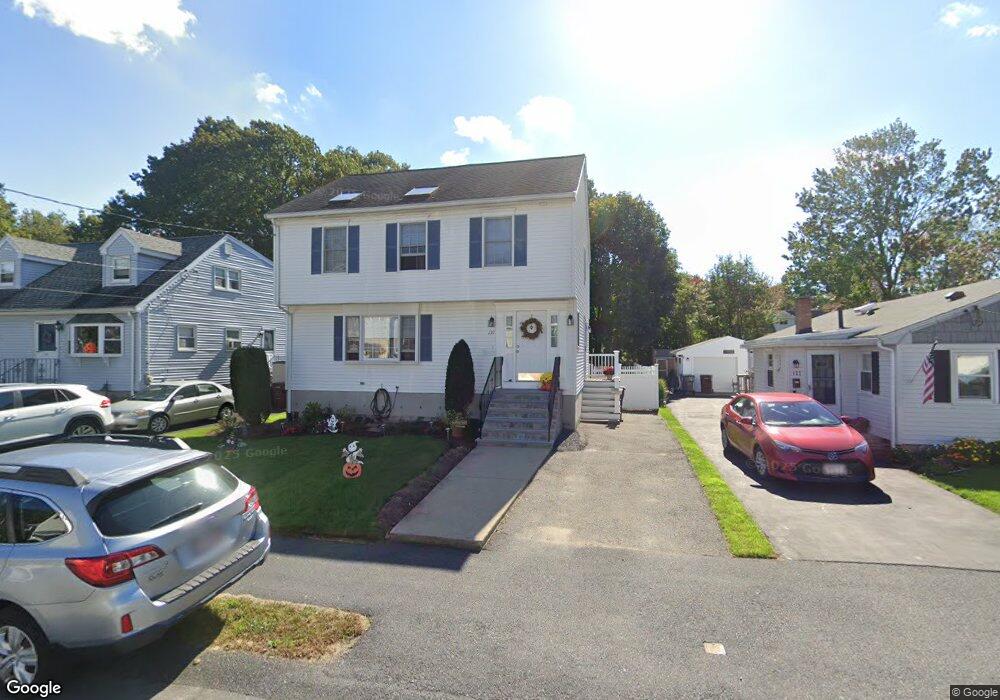
131 Crane St Dedham, MA 02026
The Manor NeighborhoodEstimated Value: $695,000 - $780,000
3
Beds
3
Baths
1,696
Sq Ft
$444/Sq Ft
Est. Value
About This Home
This home is located at 131 Crane St, Dedham, MA 02026 and is currently estimated at $753,496, approximately $444 per square foot. 131 Crane St is a home located in Norfolk County with nearby schools including Greenlodge Elementary School, Dedham Middle School, and Dedham High School.
Ownership History
Date
Name
Owned For
Owner Type
Purchase Details
Closed on
Dec 30, 2014
Sold by
Walsh Nancy M and Maloof Nancy M
Bought by
Walsh John W and Walsh Nancy M
Current Estimated Value
Purchase Details
Closed on
Jul 1, 1999
Sold by
David Tr Stephen T
Bought by
Maloof Nancy M
Home Financials for this Owner
Home Financials are based on the most recent Mortgage that was taken out on this home.
Original Mortgage
$130,000
Interest Rate
7.19%
Mortgage Type
Purchase Money Mortgage
Purchase Details
Closed on
Oct 22, 1998
Sold by
Crosby Robert
Bought by
David Tr Stephen T
Home Financials for this Owner
Home Financials are based on the most recent Mortgage that was taken out on this home.
Original Mortgage
$103,600
Interest Rate
6.74%
Mortgage Type
Purchase Money Mortgage
Create a Home Valuation Report for This Property
The Home Valuation Report is an in-depth analysis detailing your home's value as well as a comparison with similar homes in the area
Home Values in the Area
Average Home Value in this Area
Purchase History
| Date | Buyer | Sale Price | Title Company |
|---|---|---|---|
| Walsh John W | -- | -- | |
| Maloof Nancy M | $189,900 | -- | |
| David Tr Stephen T | $30,000 | -- |
Source: Public Records
Mortgage History
| Date | Status | Borrower | Loan Amount |
|---|---|---|---|
| Previous Owner | David Tr Stephen T | $130,000 | |
| Previous Owner | David Tr Stephen T | $103,600 |
Source: Public Records
Tax History
| Year | Tax Paid | Tax Assessment Tax Assessment Total Assessment is a certain percentage of the fair market value that is determined by local assessors to be the total taxable value of land and additions on the property. | Land | Improvement |
|---|---|---|---|---|
| 2025 | $8,479 | $671,900 | $323,700 | $348,200 |
| 2024 | $8,150 | $652,000 | $293,600 | $358,400 |
| 2023 | $7,368 | $573,800 | $265,900 | $307,900 |
| 2022 | $6,907 | $517,400 | $249,700 | $267,700 |
| 2021 | $6,400 | $468,200 | $231,200 | $237,000 |
| 2020 | $6,543 | $476,900 | $231,100 | $245,800 |
| 2019 | $6,089 | $430,300 | $201,000 | $229,300 |
| 2018 | $5,919 | $406,800 | $177,500 | $229,300 |
| 2017 | $5,643 | $382,300 | $166,300 | $216,000 |
| 2016 | $6,153 | $397,200 | $154,000 | $243,200 |
| 2015 | $5,956 | $375,300 | $148,500 | $226,800 |
| 2014 | $5,784 | $359,700 | $145,800 | $213,900 |
Source: Public Records
Map
Nearby Homes
Your Personal Tour Guide
Ask me questions while you tour the home.