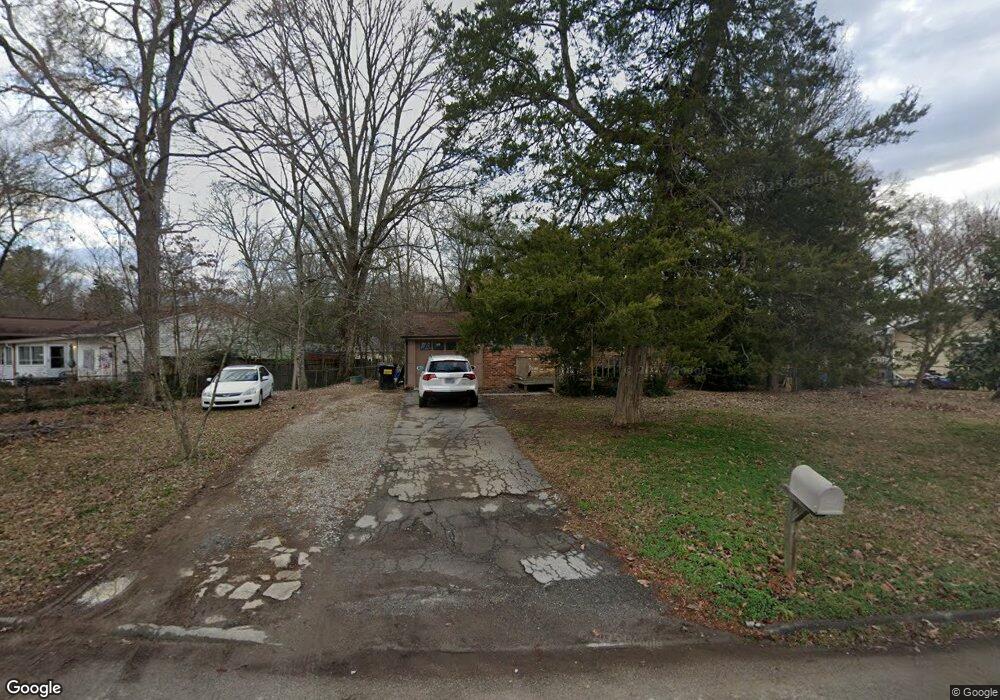
131 Delores Dr Hixson, TN 37343
Estimated Value: $238,000 - $294,442
4
Beds
2
Baths
1,959
Sq Ft
$139/Sq Ft
Est. Value
About This Home
This home is located at 131 Delores Dr, Hixson, TN 37343 and is currently estimated at $271,611, approximately $138 per square foot. 131 Delores Dr is a home located in Hamilton County with nearby schools including McConnell Elementary School, Loftis Middle School, and Berean Academy.
Ownership History
Date
Name
Owned For
Owner Type
Purchase Details
Closed on
Jul 14, 2023
Sold by
Lemme Janette E
Bought by
Lemme Janette E
Current Estimated Value
Purchase Details
Closed on
Oct 28, 2021
Sold by
Pody Michael J
Bought by
Lemme Janelle E and Lemme Busso V
Purchase Details
Closed on
Nov 20, 2007
Sold by
Obrien Kathy and Spangler Jack
Bought by
Pody Michael J and Pody Katherine
Home Financials for this Owner
Home Financials are based on the most recent Mortgage that was taken out on this home.
Original Mortgage
$101,200
Interest Rate
6.32%
Mortgage Type
Purchase Money Mortgage
Purchase Details
Closed on
May 3, 2007
Sold by
Christiano Elizabeth N
Bought by
Obrien Kathy
Purchase Details
Closed on
Jul 9, 1999
Sold by
Donahue Kathy E
Bought by
Christiano Elizabeth N
Purchase Details
Closed on
Jun 8, 1999
Sold by
Patrick Donahue
Bought by
Donahue Kathy E
Create a Home Valuation Report for This Property
The Home Valuation Report is an in-depth analysis detailing your home's value as well as a comparison with similar homes in the area
Home Values in the Area
Average Home Value in this Area
Purchase History
| Date | Buyer | Sale Price | Title Company |
|---|---|---|---|
| Lemme Janette E | -- | None Listed On Document | |
| Lemme Janelle E | $177,500 | Bridge City Title Downtown | |
| Pody Michael J | $126,500 | Century Title & Escrow Inc | |
| Obrien Kathy | -- | None Available | |
| Christiano Elizabeth N | -- | Scenic City Title Agency | |
| Donahue Kathy E | -- | Scenic City Title Agency |
Source: Public Records
Mortgage History
| Date | Status | Borrower | Loan Amount |
|---|---|---|---|
| Previous Owner | Pody Michael J | $101,200 |
Source: Public Records
Tax History Compared to Growth
Tax History
| Year | Tax Paid | Tax Assessment Tax Assessment Total Assessment is a certain percentage of the fair market value that is determined by local assessors to be the total taxable value of land and additions on the property. | Land | Improvement |
|---|---|---|---|---|
| 2024 | $851 | $38,025 | $0 | $0 |
| 2023 | $860 | $38,025 | $0 | $0 |
| 2022 | $860 | $38,025 | $0 | $0 |
| 2021 | $860 | $38,025 | $0 | $0 |
| 2020 | $783 | $28,000 | $0 | $0 |
| 2019 | $783 | $28,000 | $0 | $0 |
| 2018 | $783 | $28,000 | $0 | $0 |
| 2017 | $783 | $28,000 | $0 | $0 |
| 2016 | $778 | $0 | $0 | $0 |
| 2015 | $778 | $27,800 | $0 | $0 |
| 2014 | $778 | $0 | $0 | $0 |
Source: Public Records
Map
Nearby Homes
- 1977 Turnberry Cir
- 1963 Turnberry Cir
- 7504 Bendire Loop
- 7473 Bendire Loop
- 7450 Bendire Loop
- 7474 Bendire Loop
- 7498 Bendire Loop
- 7492 Bendire Loop
- 7468 Bendire Loop
- 7363 Bendire Loop
- Freeport Plan at The Cove at Thrasher Landing
- Hayden Plan at The Cove at Thrasher Landing
- Cali Plan at The Cove at Thrasher Landing
- Penwell Plan at The Cove at Thrasher Landing
- Edmon Plan at The Cove at Thrasher Landing
- Richland Plan at The Cove at Thrasher Landing
- Hanover Plan at The Cove at Thrasher Landing
- Belhaven Plan at The Cove at Thrasher Landing
- 7348 Bendire Loop
- 7420 Bendire Loop