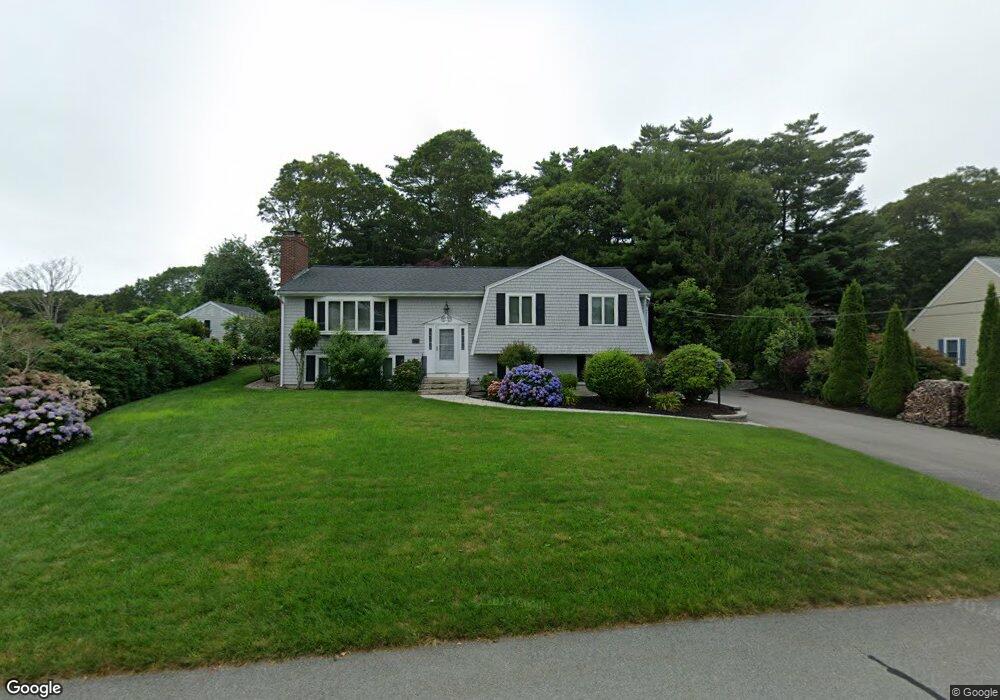
131 Elgin Rd Pocasset, MA 02559
Pocasset NeighborhoodEstimated Value: $822,000 - $1,045,000
3
Beds
2
Baths
2,448
Sq Ft
$389/Sq Ft
Est. Value
About This Home
This home is located at 131 Elgin Rd, Pocasset, MA 02559 and is currently estimated at $951,726, approximately $388 per square foot. 131 Elgin Rd is a home located in Barnstable County with nearby schools including Bourne High School, Cadence Academy Preschool - Bourne, and Heritage Christian Academy.
Ownership History
Date
Name
Owned For
Owner Type
Purchase Details
Closed on
Dec 8, 2014
Sold by
Lawver James L and Lawver Pamela
Bought by
Lawver Peggy S
Current Estimated Value
Create a Home Valuation Report for This Property
The Home Valuation Report is an in-depth analysis detailing your home's value as well as a comparison with similar homes in the area
Home Values in the Area
Average Home Value in this Area
Purchase History
| Date | Buyer | Sale Price | Title Company |
|---|---|---|---|
| Lawver Peggy S | -- | -- | |
| Lawver Peggy S | -- | -- |
Source: Public Records
Tax History Compared to Growth
Tax History
| Year | Tax Paid | Tax Assessment Tax Assessment Total Assessment is a certain percentage of the fair market value that is determined by local assessors to be the total taxable value of land and additions on the property. | Land | Improvement |
|---|---|---|---|---|
| 2025 | $6,018 | $770,500 | $444,100 | $326,400 |
| 2024 | $5,885 | $733,800 | $422,900 | $310,900 |
| 2023 | $5,123 | $581,500 | $306,200 | $275,300 |
| 2022 | $5,168 | $512,200 | $293,600 | $218,600 |
| 2021 | $5,021 | $466,200 | $267,200 | $199,000 |
| 2020 | $4,896 | $455,900 | $264,600 | $191,300 |
| 2019 | $4,680 | $445,300 | $264,600 | $180,700 |
| 2018 | $4,556 | $432,300 | $252,100 | $180,200 |
| 2017 | $4,409 | $428,100 | $249,700 | $178,400 |
| 2016 | $4,287 | $421,900 | $249,700 | $172,200 |
| 2015 | $4,192 | $416,300 | $249,700 | $166,600 |
Source: Public Records
Map
Nearby Homes
- 22 Nairn Rd
- 48 Red Brook Harbor Rd
- 3 Red Brook Pond Dr
- 1094 County Rd
- 171 Bellavista Dr
- 940 County Rd
- 34 Kenwood Rd
- 45 Kenwood Rd
- 254 Barlows Landing Rd
- 70 Wings Neck Rd
- 75 Winsor Rd
- 10 Squeteague Harbor Rd
- 1234 Route 28a
- 940 County Rd
- 1234 Route 28a
- 24 Richmond Rd
- 709 County Rd
- 89 Harbor Dr
- 7 4th Ave
- 174 Barlows Landing Rd