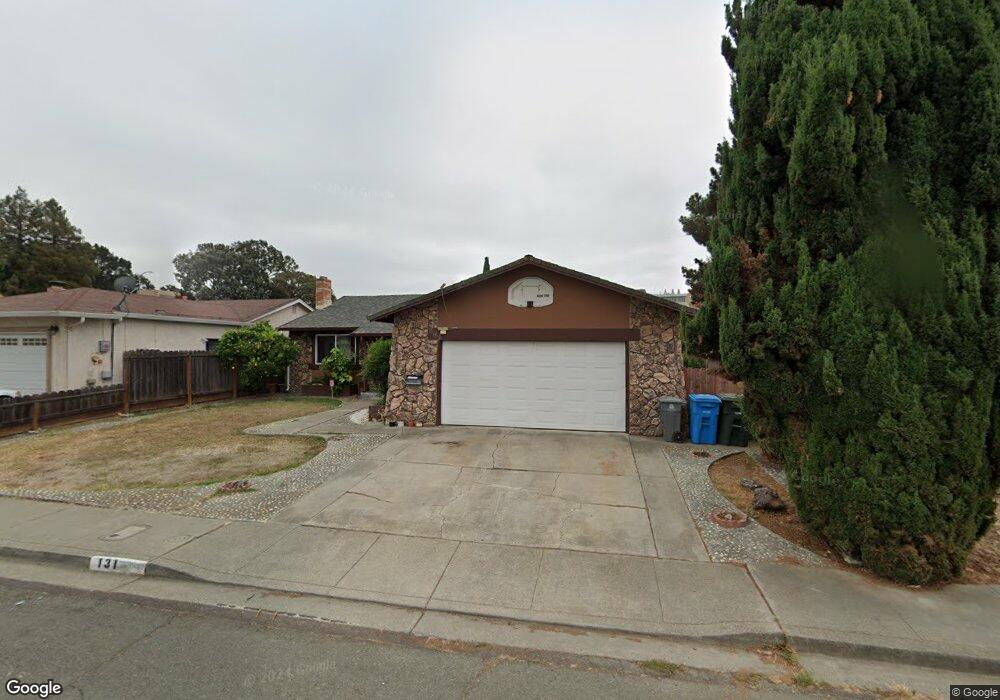
131 Fremont St Vallejo, CA 94589
West Vallejo NeighborhoodEstimated Value: $471,213 - $576,000
4
Beds
2
Baths
1,499
Sq Ft
$348/Sq Ft
Est. Value
About This Home
This home is located at 131 Fremont St, Vallejo, CA 94589 and is currently estimated at $521,553, approximately $347 per square foot. 131 Fremont St is a home located in Solano County with nearby schools including Johnston Cooper Elementary, Vallejo High School, and Caliber: ChangeMakers Academy.
Ownership History
Date
Name
Owned For
Owner Type
Purchase Details
Closed on
Oct 17, 2024
Sold by
Krk Investments Llc
Bought by
Sharma Ranika K P and Sharma Kartik R
Current Estimated Value
Purchase Details
Closed on
Sep 11, 2018
Sold by
Prasad Kapendra
Bought by
Krk Investments Llc
Purchase Details
Closed on
Apr 18, 2018
Sold by
Krk Investmetns Llc
Bought by
Prasad Kapendra
Home Financials for this Owner
Home Financials are based on the most recent Mortgage that was taken out on this home.
Original Mortgage
$212,160
Interest Rate
4.46%
Mortgage Type
Commercial
Purchase Details
Closed on
Oct 25, 2013
Sold by
Sharma Reshmi
Bought by
Krk Investments Llc
Purchase Details
Closed on
Apr 2, 2013
Sold by
Prasad Kapendra
Bought by
Sharma Reshmi
Purchase Details
Closed on
Mar 25, 2013
Sold by
Deutsche Bank National Trust Company
Bought by
Sharma Reshmi
Purchase Details
Closed on
Nov 14, 2011
Sold by
Weston Olander and Weston Rochelle
Bought by
Deutsche Bank National Trust Company
Create a Home Valuation Report for This Property
The Home Valuation Report is an in-depth analysis detailing your home's value as well as a comparison with similar homes in the area
Home Values in the Area
Average Home Value in this Area
Purchase History
| Date | Buyer | Sale Price | Title Company |
|---|---|---|---|
| Sharma Ranika K P | -- | None Listed On Document | |
| Krk Investments Llc | -- | None Available | |
| Prasad Kapendra | -- | North American Title Co Inc | |
| Krk Investments Llc | -- | None Available | |
| Sharma Reshmi | -- | Lsi Title Company Inc | |
| Sharma Reshmi | $146,000 | Lsi Title Company Inc | |
| Deutsche Bank National Trust Company | $662,302 | Accommodation |
Source: Public Records
Mortgage History
| Date | Status | Borrower | Loan Amount |
|---|---|---|---|
| Previous Owner | Prasad Kapendra | $212,160 |
Source: Public Records
Tax History Compared to Growth
Tax History
| Year | Tax Paid | Tax Assessment Tax Assessment Total Assessment is a certain percentage of the fair market value that is determined by local assessors to be the total taxable value of land and additions on the property. | Land | Improvement |
|---|---|---|---|---|
| 2025 | $3,714 | $525,000 | $155,000 | $370,000 |
| 2024 | $3,714 | $228,334 | $66,094 | $162,240 |
| 2023 | $3,482 | $223,858 | $64,799 | $159,059 |
| 2022 | $3,383 | $219,470 | $63,529 | $155,941 |
| 2021 | $3,308 | $215,168 | $62,284 | $152,884 |
| 2020 | $3,314 | $212,963 | $61,646 | $151,317 |
| 2019 | $3,206 | $208,788 | $60,438 | $148,350 |
| 2018 | $2,996 | $204,695 | $59,253 | $145,442 |
| 2017 | $2,855 | $200,683 | $58,092 | $142,591 |
| 2016 | $2,285 | $196,749 | $56,953 | $139,796 |
| 2015 | $2,256 | $193,795 | $56,098 | $137,697 |
| 2014 | $1,728 | $146,663 | $30,136 | $116,527 |
Source: Public Records
Map
Nearby Homes
- 341 Inverness Dr
- 161 Richardson Dr
- 1740 Broadway Unit 29
- 110 Upland Ct
- 206 El Sendero None
- 1500 Broadway
- 1000 N Camino Alto
- 229 Hermosa Ave
- 137 Power Dr
- 1333 N Camino Alto None Unit 114
- 129 Hermosa Ave
- 165 Oddstad Dr Unit 67
- 1333 N Camino Alto Unit 110
- 1333 N Camino Alto Unit 149
- 1333 N Camino Alto Unit 238
- 1333 N Camino Alto Unit 249
- 1333 N Camino Alto Unit 227
- 1333 N Camino Alto Unit 133
- 1214 Sereno Dr
- 136 Mesa Verde St
- 121 Fremont St
- 141 Fremont St
- 210 Inverness Dr
- 200 Inverness Dr
- 220 Inverness Dr
- 111 Fremont St
- 120 Fremont St
- 130 Fremont St
- 230 Inverness Dr
- 110 Fremont St
- 140 Fremont St
- 320 Inverness Dr
- 100 Inverness Dr
- 110 Inverness Dr
- 310 Inverness Dr
- 150 Fremont St
- 330 Inverness Dr
- 300 Inverness Dr
- 120 Inverness Dr
- 120 Magill St