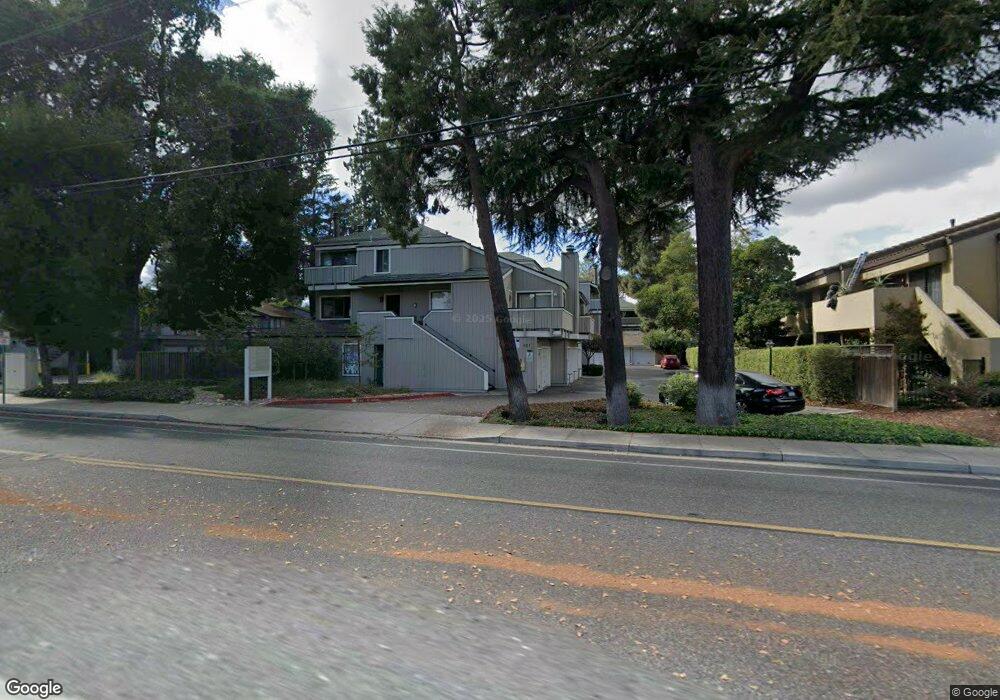
131 Union Ave Unit J Campbell, CA 95008
Estimated Value: $867,290 - $1,146,000
2
Beds
2
Baths
1,346
Sq Ft
$716/Sq Ft
Est. Value
About This Home
This home is located at 131 Union Ave Unit J, Campbell, CA 95008 and is currently estimated at $963,573, approximately $715 per square foot. 131 Union Ave Unit J is a home located in Santa Clara County with nearby schools including Bagby Elementary School, Branham High School, and Price Charter Middle School.
Ownership History
Date
Name
Owned For
Owner Type
Purchase Details
Closed on
Apr 17, 2002
Sold by
Jackson Robert Shane
Bought by
Anderson Dawn H and Davis Theresa E
Current Estimated Value
Home Financials for this Owner
Home Financials are based on the most recent Mortgage that was taken out on this home.
Original Mortgage
$295,600
Outstanding Balance
$124,899
Interest Rate
7.08%
Estimated Equity
$838,674
Purchase Details
Closed on
Jul 5, 1996
Sold by
Devries Jeanette K
Bought by
Jackson Robert Shane
Home Financials for this Owner
Home Financials are based on the most recent Mortgage that was taken out on this home.
Original Mortgage
$147,400
Interest Rate
8.3%
Purchase Details
Closed on
May 26, 1994
Sold by
Culcasi Philip C
Bought by
Devries Jeanette K
Home Financials for this Owner
Home Financials are based on the most recent Mortgage that was taken out on this home.
Original Mortgage
$157,000
Interest Rate
6.5%
Create a Home Valuation Report for This Property
The Home Valuation Report is an in-depth analysis detailing your home's value as well as a comparison with similar homes in the area
Home Values in the Area
Average Home Value in this Area
Purchase History
| Date | Buyer | Sale Price | Title Company |
|---|---|---|---|
| Anderson Dawn H | $369,500 | Chicago Title Co | |
| Jackson Robert Shane | $184,500 | Old Republic Title Company | |
| Devries Jeanette K | $187,000 | Fidelity National Title Co |
Source: Public Records
Mortgage History
| Date | Status | Borrower | Loan Amount |
|---|---|---|---|
| Open | Anderson Dawn H | $295,600 | |
| Previous Owner | Jackson Robert Shane | $147,400 | |
| Previous Owner | Devries Jeanette K | $157,000 | |
| Closed | Anderson Dawn H | $55,400 |
Source: Public Records
Tax History Compared to Growth
Tax History
| Year | Tax Paid | Tax Assessment Tax Assessment Total Assessment is a certain percentage of the fair market value that is determined by local assessors to be the total taxable value of land and additions on the property. | Land | Improvement |
|---|---|---|---|---|
| 2025 | $7,471 | $545,841 | $245,519 | $300,322 |
| 2024 | $7,471 | $535,139 | $240,705 | $294,434 |
| 2023 | $7,455 | $524,647 | $235,986 | $288,661 |
| 2022 | $7,344 | $514,360 | $231,359 | $283,001 |
| 2021 | $7,191 | $504,275 | $226,823 | $277,452 |
| 2020 | $6,859 | $499,106 | $224,498 | $274,608 |
| 2019 | $6,752 | $489,321 | $220,097 | $269,224 |
| 2018 | $6,538 | $479,728 | $215,782 | $263,946 |
| 2017 | $6,359 | $470,322 | $211,551 | $258,771 |
| 2016 | $6,024 | $461,101 | $207,403 | $253,698 |
| 2015 | $5,917 | $454,176 | $204,288 | $249,888 |
| 2014 | $5,751 | $445,281 | $200,287 | $244,994 |
Source: Public Records
Map
Nearby Homes
- 722 Duncanville Ct
- 185 Union Ave Unit 16
- 185 Union Ave Unit 75
- 68 Page St
- 866 Apricot Ave Unit C
- 665 Hawthorne Ave
- 88 La Paz Way Unit 88
- 382 Union Ave Unit C
- 178 Salmar Terrace
- 515 Union Ave
- 521 Union Ave
- 110 S 1st St Unit 110
- 912 Campisi Way Unit 115
- 912 Campisi Way Unit 201
- 186 E Rincon Ave
- 195 Sunnyside Ave
- 876 Dry Creek Rd
- 21 N 2nd St Unit 306
- 21 N 2nd St Unit 303
- 701 Sweetbriar Dr
- 137 Union Ave
- 135 Union Ave Unit C
- 135 Union Ave Unit B
- 135 Union Ave Unit A
- 131 Union Ave Unit H
- 131 Union Ave Unit G
- 131 Union Ave Unit F
- 131 Union Ave Unit E
- 131 Union Ave Unit D
- 131 Union Ave Unit C
- 131 Union Ave Unit B
- 131 Union Ave Unit A
- 137 Union Ave Unit E
- 137 Union Ave Unit D
- 137 Union Ave Unit C
- 137 Union Ave Unit B
- 137 Union Ave Unit A
- 135 Union Ave Unit E
- 135 Union Ave Unit D
- 721 Duncanville Ct