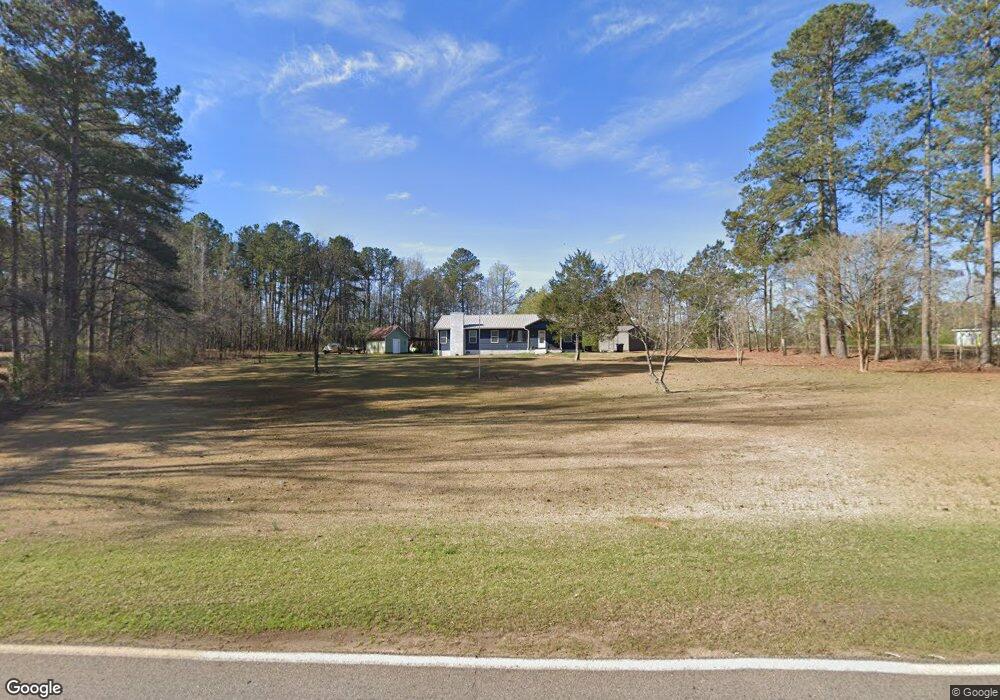
131 Vernon Ferry Rd Lagrange, GA 30240
Estimated Value: $139,000 - $206,000
2
Beds
1
Bath
1,344
Sq Ft
$133/Sq Ft
Est. Value
About This Home
This home is located at 131 Vernon Ferry Rd, Lagrange, GA 30240 and is currently estimated at $178,848, approximately $133 per square foot. 131 Vernon Ferry Rd is a home located in Troup County with nearby schools including Ethel W. Kight Elementary School, Hollis Hand Elementary School, and Franklin Forest Elementary School.
Ownership History
Date
Name
Owned For
Owner Type
Purchase Details
Closed on
Jan 30, 2019
Sold by
Shaddix Serena L
Bought by
Fountain Donnie Ray and Meyers Teresa Lynn
Current Estimated Value
Purchase Details
Closed on
Feb 5, 2010
Sold by
Hooten Patricia
Bought by
Shaddix Serena L
Purchase Details
Closed on
Dec 17, 2008
Sold by
Shaddix Serena Lee
Bought by
Shaddix Serena L and Hooten Patricia
Purchase Details
Closed on
Dec 21, 2006
Sold by
Hunter Christopher T
Bought by
Richardson Glayds H
Purchase Details
Closed on
May 25, 2006
Sold by
Richardson Gladys H Stroud
Bought by
Hunter Christopher T and Hunter Paulette M
Purchase Details
Closed on
Oct 25, 1984
Sold by
Richardson Charles E Int
Bought by
Richardson Gladys H Stroud
Purchase Details
Closed on
Feb 18, 1975
Sold by
Stroud James B
Bought by
Richardson Charles E Int
Purchase Details
Closed on
Aug 1, 1950
Sold by
Phipps B F Etal
Bought by
Stroud James B
Create a Home Valuation Report for This Property
The Home Valuation Report is an in-depth analysis detailing your home's value as well as a comparison with similar homes in the area
Purchase History
| Date | Buyer | Sale Price | Title Company |
|---|---|---|---|
| Fountain Donnie Ray | $113,500 | -- | |
| Shaddix Serena L | $21,500 | -- | |
| Shaddix Serena L | $21,500 | -- | |
| Shaddix Serena L | -- | -- | |
| Richardson Glayds H | -- | -- | |
| Hunter Christopher T | $60,000 | -- | |
| Richardson Gladys H Stroud | -- | -- | |
| Richardson Charles E Int | -- | -- | |
| Stroud James B | -- | -- |
Source: Public Records
Tax History
| Year | Tax Paid | Tax Assessment Tax Assessment Total Assessment is a certain percentage of the fair market value that is determined by local assessors to be the total taxable value of land and additions on the property. | Land | Improvement |
|---|---|---|---|---|
| 2025 | $1,348 | $55,880 | $6,440 | $49,440 |
| 2024 | $1,126 | $43,280 | $6,440 | $36,840 |
| 2023 | $539 | $39,640 | $6,440 | $33,200 |
| 2022 | $995 | $37,640 | $6,440 | $31,200 |
| 2021 | $1,049 | $36,760 | $5,800 | $30,960 |
| 2020 | $1,027 | $36,040 | $5,800 | $30,240 |
| 2019 | $768 | $25,480 | $4,920 | $20,560 |
| 2018 | $730 | $24,200 | $5,520 | $18,680 |
| 2017 | $730 | $24,200 | $5,520 | $18,680 |
| 2016 | $559 | $18,526 | $5,520 | $13,006 |
| 2015 | $560 | $18,526 | $5,520 | $13,006 |
| 2014 | $540 | $17,841 | $5,520 | $12,321 |
| 2013 | -- | $18,814 | $5,520 | $13,294 |
Source: Public Records
Map
Nearby Homes
- 440 & 448 Kimbrough Rd
- 4.5 ACRES Whatley Rd N
- 0 Deming St Unit 10550189
- 0 Salem Rd Tract 2 Unit 10675187
- 104 Bridlewood Dr
- 200 Cheyenne Dr
- 124 Foxdale Dr
- 336 Whitaker Rd
- 135 Planters Ridge Dr
- 203 Shawnee Dr
- 509 Connie Dr
- 117 Brookwood Dr
- 104 Spring Valley Dr
- 217 Highland Trail
- 223 Pinehaven Dr
- 427 Fling Rd
- 641 Whitaker Rd
- 4004 White Oak Ln
- 104 Dogwood Point
- 8 Horace Carter Rd
- 155 Vernon Ferry Rd
- 91 Vernon Ferry Rd
- 3228 Roanoke Rd
- 3248 Roanoke Rd
- 3256 Roanoke Rd
- 179 Vernon Ferry Rd
- 172 Vernon Ferry Rd
- 3208 Roanoke Rd
- 78 Vernon Ferry Rd
- 3278 Roanoke Rd
- 3290 Roanoke Rd
- 66 Vernon Ferry Rd
- 193 Vernon Ferry Rd
- 59 Vernon Ferry Rd
- 206 Vernon Ferry Rd
- 3366 Roanoke Rd
- 3245 Roanoke Rd
- 3320 Roanoke Rd
- 24 Hearn Rd
- 219 Vernon Ferry Rd
Your Personal Tour Guide
Ask me questions while you tour the home.