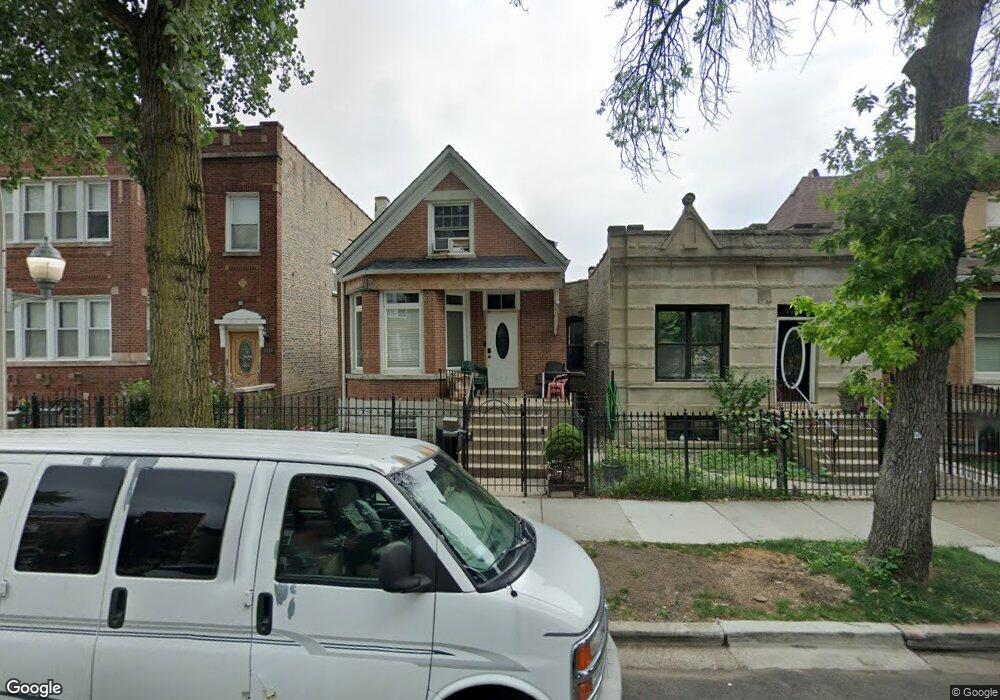
1310 N Ridgeway Ave Chicago, IL 60651
Humboldt Park NeighborhoodEstimated Value: $261,758 - $340,000
3
Beds
2
Baths
909
Sq Ft
$321/Sq Ft
Est. Value
About This Home
This home is located at 1310 N Ridgeway Ave, Chicago, IL 60651 and is currently estimated at $291,690, approximately $320 per square foot. 1310 N Ridgeway Ave is a home located in Cook County with nearby schools including Cameron Elementary School, Orr Academy High School, and Rowe-Clark Math & Science Academy.
Ownership History
Date
Name
Owned For
Owner Type
Purchase Details
Closed on
Dec 13, 2019
Sold by
Garach Victor
Bought by
Garach Xenia and Collazo Julian
Current Estimated Value
Purchase Details
Closed on
Aug 5, 2011
Sold by
Fannie Mae
Bought by
Garach Victor
Purchase Details
Closed on
Nov 30, 2010
Sold by
Ferrer Julio Angel
Bought by
Citimortgage Inc
Purchase Details
Closed on
Dec 20, 2006
Sold by
Feliciano Guzman Juana and Feliciano Rosario
Bought by
Ferrer Julio Angel
Home Financials for this Owner
Home Financials are based on the most recent Mortgage that was taken out on this home.
Original Mortgage
$176,000
Interest Rate
7.28%
Mortgage Type
Unknown
Purchase Details
Closed on
Sep 25, 2002
Sold by
Rivera Dolores and Rivera Maria A
Bought by
Feliciano Guzman Juana and Feliciano Rosario
Home Financials for this Owner
Home Financials are based on the most recent Mortgage that was taken out on this home.
Original Mortgage
$144,637
Interest Rate
6.34%
Mortgage Type
FHA
Create a Home Valuation Report for This Property
The Home Valuation Report is an in-depth analysis detailing your home's value as well as a comparison with similar homes in the area
Home Values in the Area
Average Home Value in this Area
Purchase History
| Date | Buyer | Sale Price | Title Company |
|---|---|---|---|
| Garach Xenia | -- | None Available | |
| Garach Victor | $45,000 | First American Title | |
| Citimortgage Inc | -- | None Available | |
| Ferrer Julio Angel | $220,000 | Heritage Title Company | |
| Feliciano Guzman Juana | $147,000 | -- |
Source: Public Records
Mortgage History
| Date | Status | Borrower | Loan Amount |
|---|---|---|---|
| Previous Owner | Ferrer Julio Angel | $176,000 | |
| Previous Owner | Feliciano Guzman Juana | $144,637 |
Source: Public Records
Tax History
| Year | Tax Paid | Tax Assessment Tax Assessment Total Assessment is a certain percentage of the fair market value that is determined by local assessors to be the total taxable value of land and additions on the property. | Land | Improvement |
|---|---|---|---|---|
| 2025 | $2,896 | $21,000 | $4,464 | $16,536 |
| 2024 | $2,896 | $21,000 | $4,464 | $16,536 |
| 2023 | $2,793 | $17,000 | $3,571 | $13,429 |
| 2022 | $2,793 | $17,000 | $3,571 | $13,429 |
| 2021 | $2,749 | $16,999 | $3,571 | $13,428 |
| 2020 | $2,374 | $13,759 | $4,166 | $9,593 |
| 2019 | $2,417 | $15,460 | $4,166 | $11,294 |
| 2018 | $2,375 | $15,460 | $4,166 | $11,294 |
| 2017 | $2,003 | $12,681 | $3,720 | $8,961 |
| 2016 | $2,040 | $12,681 | $3,720 | $8,961 |
| 2015 | $1,843 | $12,681 | $3,720 | $8,961 |
| 2014 | $1,865 | $12,618 | $3,571 | $9,047 |
| 2013 | $1,817 | $12,618 | $3,571 | $9,047 |
Source: Public Records
Map
Nearby Homes
- 1001 N Hamlin Ave
- 1234 N Lawndale Ave
- 1336 N Hamlin Ave
- 1346 N Lawndale Ave
- 1328 N Avers Ave
- 1400 N Lawndale Ave
- 1410 N Avers Ave
- 1130 N Hamlin Ave
- 1142 N Monticello Ave
- 1121 N Lawndale Ave
- 3516 W Hirsch St
- 1028 N Hamlin Ave
- 4016 W Crystal St
- 1033 N Lawndale Ave
- 1029 N Avers Ave
- 1010 N Ridgeway Ave
- 4027 W Crystal St Unit 2
- 1032 N Springfield Ave
- 1529 N Harding Ave
- 3440 W Hirsch St
- 1312 N Ridgeway Ave
- 1308 N Ridgeway Ave Unit 2
- 1316 N Ridgeway Ave
- 1318 N Ridgeway Ave
- 1300 N Ridgeway Ave
- 1322 N Ridgeway Ave
- 1326 N Ridgeway Ave
- 1326 N Ridgeway Ave Unit 1
- 1327 N Hamlin Ave
- 1315 N Hamlin Ave
- 1319 N Hamlin Ave Unit 2
- 1328 N Ridgeway Ave Unit 2
- 1309 N Ridgeway Ave Unit 1
- 1321 N Ridgeway Ave Unit 1F
- 1315 N Ridgeway Ave
- 1321 N Hamlin Ave Unit 2
- 1321 N Hamlin Ave
- 1317 N Ridgeway Ave
- 1305 N Ridgeway Ave
- 1330 N Ridgeway Ave
Your Personal Tour Guide
Ask me questions while you tour the home.