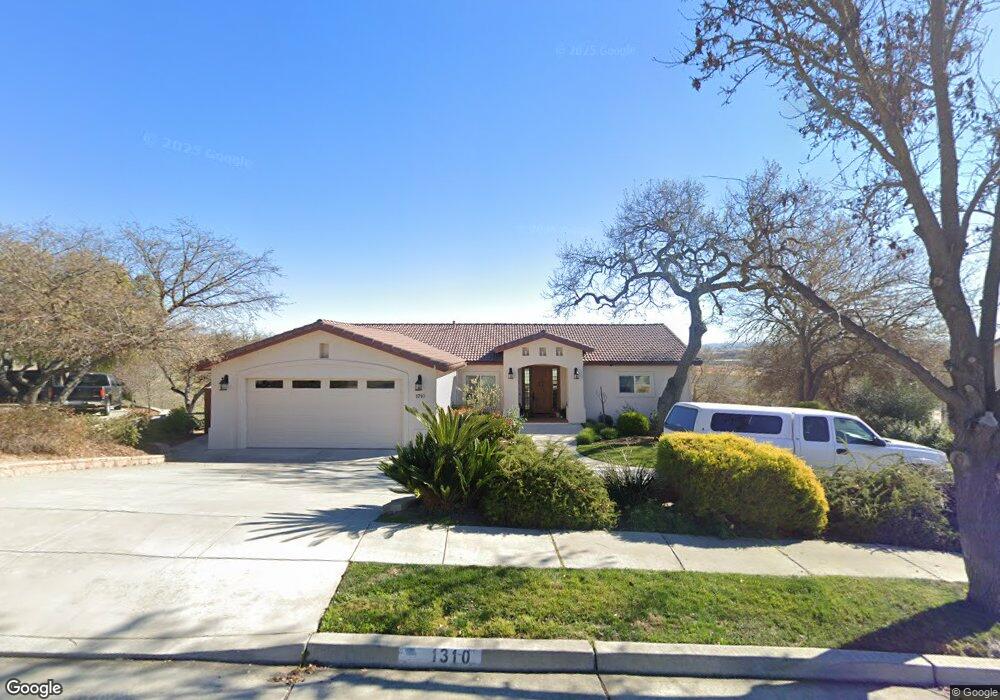
1310 Oak Ridge Way Unit L150 Paso Robles, CA 93446
Estimated Value: $986,000 - $1,153,000
3
Beds
3
Baths
2,863
Sq Ft
$385/Sq Ft
Est. Value
About This Home
This home is located at 1310 Oak Ridge Way Unit L150, Paso Robles, CA 93446 and is currently estimated at $1,102,197, approximately $384 per square foot. 1310 Oak Ridge Way Unit L150 is a home located in San Luis Obispo County with nearby schools including Kermit King Elementary School, Daniel Lewis Middle School, and Paso Robles High School.
Ownership History
Date
Name
Owned For
Owner Type
Purchase Details
Closed on
Jul 12, 2016
Sold by
Taylor George C and Taylor Rebecca A
Bought by
Arbuckle William S and Arbuckle Kelli E
Current Estimated Value
Home Financials for this Owner
Home Financials are based on the most recent Mortgage that was taken out on this home.
Original Mortgage
$440,000
Outstanding Balance
$350,799
Interest Rate
3.54%
Mortgage Type
New Conventional
Estimated Equity
$751,398
Purchase Details
Closed on
Jan 29, 2010
Sold by
Villa Paul E and Villa Debra A
Bought by
Taylor George C and Taylor Rebecca A
Home Financials for this Owner
Home Financials are based on the most recent Mortgage that was taken out on this home.
Original Mortgage
$275,000
Interest Rate
5.01%
Mortgage Type
New Conventional
Purchase Details
Closed on
Dec 4, 2001
Sold by
Shadow Canyon Estates
Bought by
Villa Paul E and Villa Debra A
Create a Home Valuation Report for This Property
The Home Valuation Report is an in-depth analysis detailing your home's value as well as a comparison with similar homes in the area
Home Values in the Area
Average Home Value in this Area
Purchase History
| Date | Buyer | Sale Price | Title Company |
|---|---|---|---|
| Arbuckle William S | $640,000 | Fidelity National Title Co | |
| Taylor George C | $564,000 | First American Title Company | |
| Villa Paul E | $129,500 | Fidelity National Title Co |
Source: Public Records
Mortgage History
| Date | Status | Borrower | Loan Amount |
|---|---|---|---|
| Open | Arbuckle William S | $440,000 | |
| Previous Owner | Taylor George C | $275,000 |
Source: Public Records
Tax History Compared to Growth
Tax History
| Year | Tax Paid | Tax Assessment Tax Assessment Total Assessment is a certain percentage of the fair market value that is determined by local assessors to be the total taxable value of land and additions on the property. | Land | Improvement |
|---|---|---|---|---|
| 2025 | $8,873 | $742,769 | $232,114 | $510,655 |
| 2024 | $8,708 | $728,206 | $227,563 | $500,643 |
| 2023 | $8,708 | $713,928 | $223,101 | $490,827 |
| 2022 | $8,502 | $699,930 | $218,727 | $481,203 |
| 2021 | $8,368 | $686,207 | $214,439 | $471,768 |
| 2020 | $8,229 | $679,172 | $212,241 | $466,931 |
| 2019 | $8,103 | $665,856 | $208,080 | $457,776 |
| 2018 | $8,001 | $652,800 | $204,000 | $448,800 |
| 2017 | $7,537 | $640,000 | $200,000 | $440,000 |
| 2016 | $7,071 | $599,000 | $170,000 | $429,000 |
| 2015 | $6,977 | $585,000 | $165,000 | $420,000 |
| 2014 | -- | $550,000 | $155,000 | $395,000 |
Source: Public Records
Map
Nearby Homes
- 1312 Oak Ridge Way
- 331 Wild Mustard Ln
- 378 Lark Dr
- 315 Oak Meadow Ln
- 1150 Grassy Hollow Way
- 1320 Teal Ave
- 1136 Mazzini Rd
- 210 Partridge Ave
- 230 Partridge Ave
- 326 Partridge Ave
- 225 Lark Dr
- Excite II Plan at Nevina - Freedom 50
- Reunion II Plan at Nevina - Freedom 40
- Vertex Plan at Nevina - Freedom 60
- Liberty II Plan at Nevina - Freedom 50
- Affirm II Plan at Nevina - Freedom 40
- Pinnacle Plan at Nevina - Freedom 60
- Proclaim II Plan at Nevina - Freedom 50
- Connect II Plan at Nevina - Freedom 40
- Meridian Plan at Nevina - Freedom 60
- 1310 Oak Ridge Way
- 1312 Oak Ridge Way Unit L149
- 1308 Oak Ridge Way Unit L151
- 1308 Oak Ridge Way
- 1311 Oak Ridge Way Unit L146
- 1311 Oak Ridge Way
- 0 Oak Ridge Way Unit PR165923
- 0 Oak Ridge Way Unit AT173557
- 0 Oak Ridge Unit PR183068
- 0 Oak Ridge Unit PR196639
- 0 Oak Ridge Way Unit 119893
- 0 Oak Ridge Unit PR165923
- 1314 Oak Ridge Way Unit L148
- 1314 Oak Ridge Way
- 1307 Oak Ridge Way
- 1306 Oak Ridge Way
- 1312 Crescent Oaks Way
- 1310 Crescent Oaks Way Unit L138
- 1310 Crescent Oaks Way
- 1308 Crescent Oaks Way Unit L139