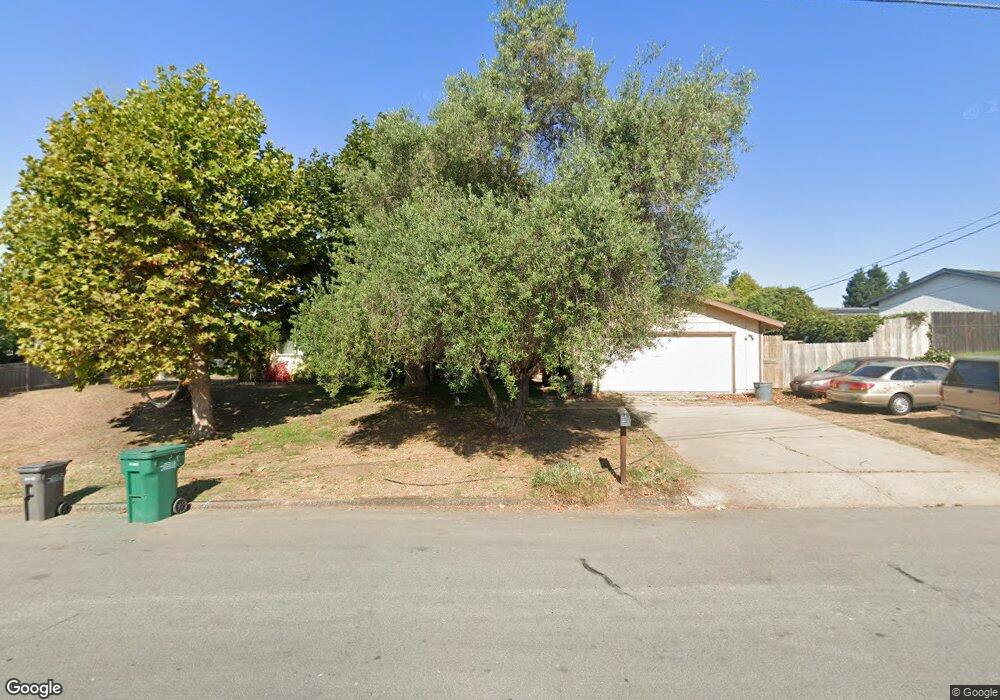
1310 Primavera Ln Nipomo, CA 93444
Estimated Value: $493,000 - $1,290,000
4
Beds
3
Baths
2,200
Sq Ft
$434/Sq Ft
Est. Value
About This Home
This home is located at 1310 Primavera Ln, Nipomo, CA 93444 and is currently estimated at $955,716, approximately $434 per square foot. 1310 Primavera Ln is a home located in San Luis Obispo County with nearby schools including Dorothea Lange Elementary School, Mesa Middle School, and Nipomo High School.
Ownership History
Date
Name
Owned For
Owner Type
Purchase Details
Closed on
Jul 12, 2023
Sold by
Minko Ashley R
Bought by
A Randal Minko Living Trust and Minko
Current Estimated Value
Purchase Details
Closed on
Mar 7, 2021
Sold by
Minko Ashley R
Bought by
Minko Ashley R
Home Financials for this Owner
Home Financials are based on the most recent Mortgage that was taken out on this home.
Original Mortgage
$171,000
Interest Rate
2.73%
Mortgage Type
New Conventional
Purchase Details
Closed on
Sep 28, 2020
Sold by
Minko Susan
Bought by
Minko Ashley R
Purchase Details
Closed on
Mar 7, 1996
Sold by
Racusin Michele Ann
Bought by
Minko Ashley R and Minko Susan
Home Financials for this Owner
Home Financials are based on the most recent Mortgage that was taken out on this home.
Original Mortgage
$144,000
Interest Rate
6.98%
Create a Home Valuation Report for This Property
The Home Valuation Report is an in-depth analysis detailing your home's value as well as a comparison with similar homes in the area
Home Values in the Area
Average Home Value in this Area
Purchase History
| Date | Buyer | Sale Price | Title Company |
|---|---|---|---|
| A Randal Minko Living Trust | -- | None Listed On Document | |
| Minko Ashley R | -- | Servicelink | |
| Minko Ashley R | -- | None Available | |
| Minko Ashley R | $180,000 | First American Title |
Source: Public Records
Mortgage History
| Date | Status | Borrower | Loan Amount |
|---|---|---|---|
| Previous Owner | Minko Ashley R | $171,000 | |
| Previous Owner | Minko Ashley R | $144,000 |
Source: Public Records
Tax History Compared to Growth
Tax History
| Year | Tax Paid | Tax Assessment Tax Assessment Total Assessment is a certain percentage of the fair market value that is determined by local assessors to be the total taxable value of land and additions on the property. | Land | Improvement |
|---|---|---|---|---|
| 2025 | $3,661 | $363,106 | $124,573 | $238,533 |
| 2024 | $3,618 | $355,987 | $122,131 | $233,856 |
| 2023 | $3,618 | $349,008 | $119,737 | $229,271 |
| 2022 | $3,562 | $342,166 | $117,390 | $224,776 |
| 2021 | $3,554 | $335,458 | $115,089 | $220,369 |
| 2020 | $3,513 | $332,019 | $113,909 | $218,110 |
| 2019 | $3,490 | $325,510 | $111,676 | $213,834 |
| 2018 | $3,446 | $319,129 | $109,487 | $209,642 |
| 2017 | $3,380 | $312,873 | $107,341 | $205,532 |
| 2016 | $3,187 | $306,739 | $105,237 | $201,502 |
| 2015 | $3,140 | $302,133 | $103,657 | $198,476 |
| 2014 | $3,022 | $296,216 | $101,627 | $194,589 |
Source: Public Records
Map
Nearby Homes
- 468 Neptune Dr
- 1655 Kirby Way
- 1180 Starlite Dr
- 1127 Starlite Dr
- 945 Jeanette Ln
- 393 Uranus Ct
- 457 Polaris Dr
- 840 Story St
- 426 Polaris Dr
- 1431 La Loma Dr
- 522 Higos Way
- 725 Monarch Ln
- 261 Hazel Ln
- 1765 Division St
- 483 Violet Ave
- 626 Juno Ct
- 232 Scarlett Cir
- 450 Avenida de Socios Unit 12
- 368 Avenida de Amigos
- Mesa Plan at Hill Street Terraces - Hill Street Series
- 0 Primavera Ln Unit 974183
- 0 Primavera Ln Unit LOT
- 1290 Primavera Ln
- 1330 Primavera Ln
- 1331 Primavera Ln
- 1350 Primavera Ln
- 1260 Primavera Ln
- 1315 Humboldt Dr
- 1295 Humboldt Dr
- 736 Sierra Rd
- 1285 Primavera Ln
- 1351 Primavera Ln
- 1285 Humboldt Dr
- 1370 Primavera Ln
- 1245 Primavera Ln
- 1275 Humboldt Dr
- 1230 Primavera Ln
- 1371 Primavera Ln
- 690 Cascade Ln