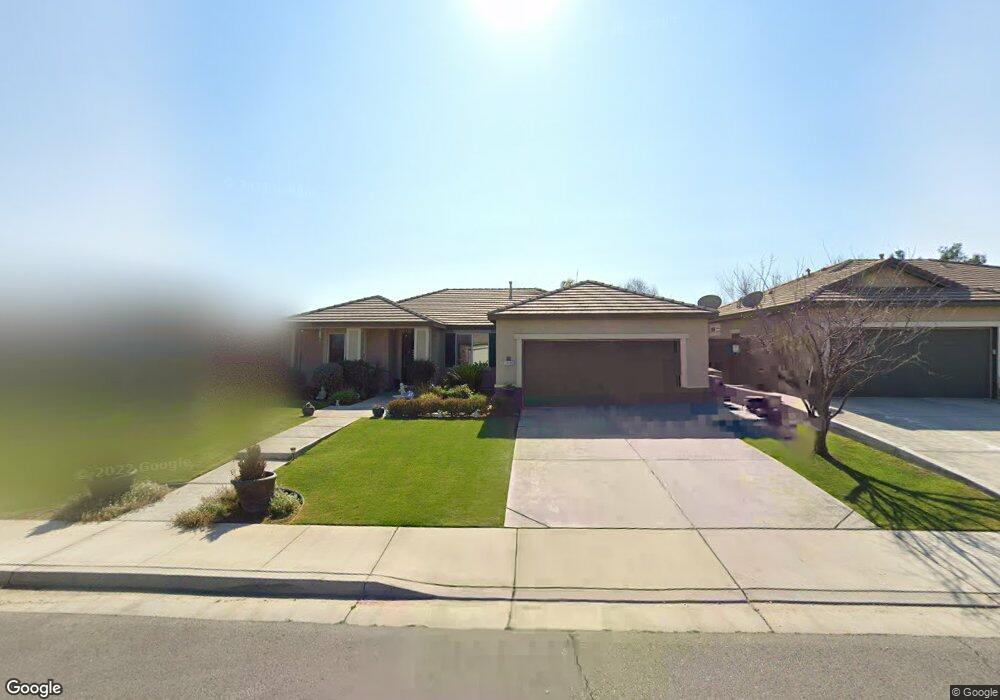
13105 Evening Breeze Ave Bakersfield, CA 93314
Estimated Value: $416,000 - $440,000
4
Beds
2
Baths
1,737
Sq Ft
$246/Sq Ft
Est. Value
About This Home
This home is located at 13105 Evening Breeze Ave, Bakersfield, CA 93314 and is currently estimated at $426,830, approximately $245 per square foot. 13105 Evening Breeze Ave is a home located in Kern County with nearby schools including Patriot Elementary School, Freedom Middle School, and Frontier High School.
Ownership History
Date
Name
Owned For
Owner Type
Purchase Details
Closed on
Jul 26, 2010
Sold by
Kaur Manpreet
Bought by
Singh Karamjit and Kaur Manpreet
Current Estimated Value
Home Financials for this Owner
Home Financials are based on the most recent Mortgage that was taken out on this home.
Original Mortgage
$165,600
Interest Rate
4.71%
Mortgage Type
New Conventional
Purchase Details
Closed on
Jun 11, 2010
Sold by
Lennar Homes Of California Inc
Bought by
Kaur Manpreet
Home Financials for this Owner
Home Financials are based on the most recent Mortgage that was taken out on this home.
Original Mortgage
$165,600
Interest Rate
4.71%
Mortgage Type
New Conventional
Purchase Details
Closed on
Jun 10, 2010
Sold by
Singh Karamjit
Bought by
Kaur Manpreet
Home Financials for this Owner
Home Financials are based on the most recent Mortgage that was taken out on this home.
Original Mortgage
$165,600
Interest Rate
4.71%
Mortgage Type
New Conventional
Create a Home Valuation Report for This Property
The Home Valuation Report is an in-depth analysis detailing your home's value as well as a comparison with similar homes in the area
Home Values in the Area
Average Home Value in this Area
Purchase History
| Date | Buyer | Sale Price | Title Company |
|---|---|---|---|
| Singh Karamjit | -- | None Available | |
| Kaur Manpreet | $207,000 | North American Title Company | |
| Kaur Manpreet | -- | North American Title Co Inc |
Source: Public Records
Mortgage History
| Date | Status | Borrower | Loan Amount |
|---|---|---|---|
| Previous Owner | Kaur Manpreet | $165,600 |
Source: Public Records
Tax History Compared to Growth
Tax History
| Year | Tax Paid | Tax Assessment Tax Assessment Total Assessment is a certain percentage of the fair market value that is determined by local assessors to be the total taxable value of land and additions on the property. | Land | Improvement |
|---|---|---|---|---|
| 2025 | $4,714 | $265,188 | $51,240 | $213,948 |
| 2024 | $4,606 | $259,989 | $50,236 | $209,753 |
| 2023 | $4,606 | $254,892 | $49,251 | $205,641 |
| 2022 | $4,528 | $249,895 | $48,286 | $201,609 |
| 2021 | $4,397 | $244,996 | $47,340 | $197,656 |
| 2020 | $4,337 | $242,485 | $46,855 | $195,630 |
| 2019 | $4,270 | $242,485 | $46,855 | $195,630 |
| 2018 | $4,180 | $233,072 | $45,037 | $188,035 |
| 2017 | $4,126 | $228,503 | $44,154 | $184,349 |
| 2016 | $3,936 | $224,024 | $43,289 | $180,735 |
| 2015 | $3,894 | $220,660 | $42,639 | $178,021 |
| 2014 | $3,843 | $216,338 | $41,804 | $174,534 |
Source: Public Records
Map
Nearby Homes
- 13416 Ridgeway Meadows Dr
- 5308 Elk Run Ct
- 13100 Yampa River St Unit 3
- 13432 Ridgeway Meadows Dr
- 13118 Ridgeway Meadows Dr
- 13404 Cheyenne Mountain Dr
- 13500 Sunlight Star St
- 13421 Cheyenne Mountain Dr
- 12600 Hawaii Ln
- 6002 Dartmoor Wood Ave
- 6006 Dartmoor Wood Ave
- 12709 Montbatten Place
- 12809 Trafalgar Square Dr
- 12710 Lanai Ave
- 6110 Ozark Mountain Dr
- 13404 Scafell Pike St
- 6010 Inverwood Dr
- Oriole Plan at Laurelwood
- Lark Plan at Laurelwood
- Sparrow Plan at Laurelwood
- 13101 Evening Breeze Ave
- 13109 Evening Breeze Ave
- 13027 Evening Breeze Ave
- 13208 Jackson Lake Dr Unit 3
- 13204 Jackson Lake Dr
- 13212 Jackson Lake Dr Unit 3
- 13200 Jackson Lake Dr Unit 3
- 13023 Evening Breeze Ave
- 13104 Evening Breeze Ave
- 13118 Jackson Lake Dr
- 13203 Evening Breeze Ave
- 13108 Evening Breeze Ave
- 13302 Jackson Lake Dr
- 13022 Evening Breeze Ave
- 13202 Evening Breeze Ave
- 13019 Evening Breeze Ave
- 13114 Jackson Lake Dr
- 13207 Evening Breeze Ave
- 13306 Jackson Lake Dr Unit 3
- 13018 Evening Breeze Ave