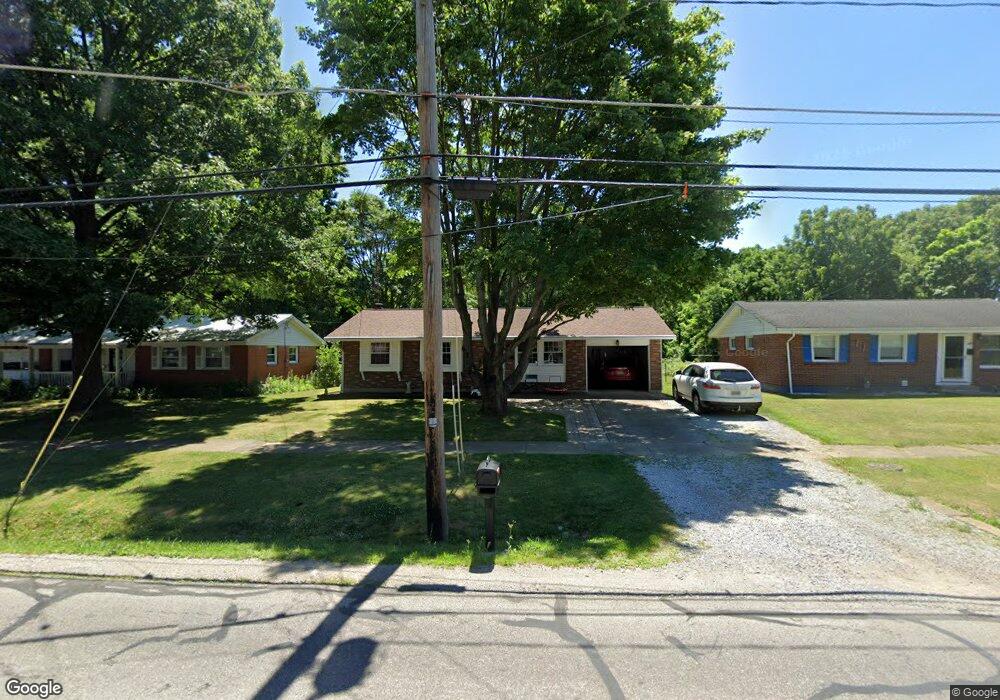
1311 Orange Rd Ashland, OH 44805
Estimated Value: $118,000 - $166,125
3
Beds
2
Baths
900
Sq Ft
$160/Sq Ft
Est. Value
About This Home
This home is located at 1311 Orange Rd, Ashland, OH 44805 and is currently estimated at $144,281, approximately $160 per square foot. 1311 Orange Rd is a home located in Ashland County with nearby schools including Ashland High School, Ashland County Community Academy, and St. Edward Elementary School.
Ownership History
Date
Name
Owned For
Owner Type
Purchase Details
Closed on
Jul 30, 2010
Bought by
Farnsworth Glenn A and Farnsworth Deborah E
Current Estimated Value
Purchase Details
Closed on
May 27, 2010
Sold by
Nebergall Daniel R
Purchase Details
Closed on
Feb 4, 2005
Sold by
Benner Jeffrey W
Bought by
Nebergall Daniel R
Purchase Details
Closed on
Jul 19, 1999
Sold by
Carver Jason A
Bought by
Benner Jeffrey W
Purchase Details
Closed on
Jun 2, 1997
Sold by
Heintz Brian M
Bought by
Carver Jason A
Purchase Details
Closed on
May 8, 1995
Bought by
Grabenstetter Paul J
Create a Home Valuation Report for This Property
The Home Valuation Report is an in-depth analysis detailing your home's value as well as a comparison with similar homes in the area
Home Values in the Area
Average Home Value in this Area
Purchase History
| Date | Buyer | Sale Price | Title Company |
|---|---|---|---|
| Farnsworth Glenn A | $49,000 | -- | |
| -- | $52,300 | -- | |
| Nebergall Daniel R | $96,900 | -- | |
| Benner Jeffrey W | $76,000 | -- | |
| Carver Jason A | $74,000 | -- | |
| Grabenstetter Paul J | -- | -- |
Source: Public Records
Tax History Compared to Growth
Tax History
| Year | Tax Paid | Tax Assessment Tax Assessment Total Assessment is a certain percentage of the fair market value that is determined by local assessors to be the total taxable value of land and additions on the property. | Land | Improvement |
|---|---|---|---|---|
| 2024 | $925 | $36,560 | $6,510 | $30,050 |
| 2023 | $925 | $36,560 | $6,510 | $30,050 |
| 2022 | $1,228 | $28,120 | $5,010 | $23,110 |
| 2021 | $851 | $28,120 | $5,010 | $23,110 |
| 2020 | $806 | $28,120 | $5,010 | $23,110 |
| 2019 | $749 | $25,410 | $5,210 | $20,200 |
| 2018 | $756 | $25,410 | $5,210 | $20,200 |
| 2017 | $1,049 | $25,410 | $5,210 | $20,200 |
| 2016 | $1,049 | $22,100 | $4,530 | $17,570 |
| 2015 | $1,040 | $22,100 | $4,530 | $17,570 |
| 2013 | $1,313 | $27,480 | $4,590 | $22,890 |
Source: Public Records
Map
Nearby Homes