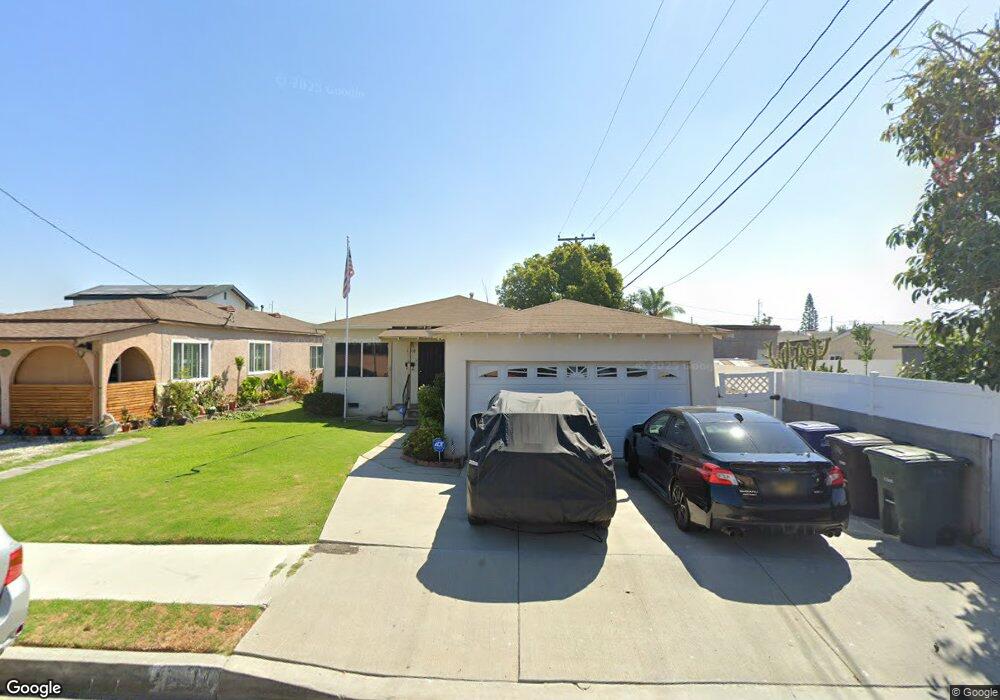
13110 Shoup Ave Hawthorne, CA 90250
Del Aire NeighborhoodEstimated Value: $906,000 - $1,084,000
3
Beds
2
Baths
1,130
Sq Ft
$872/Sq Ft
Est. Value
About This Home
This home is located at 13110 Shoup Ave, Hawthorne, CA 90250 and is currently estimated at $985,077, approximately $871 per square foot. 13110 Shoup Ave is a home located in Los Angeles County with nearby schools including Hollyglen Elementary School, Aviation Elementary School, and Richard Henry Dana Middle School.
Ownership History
Date
Name
Owned For
Owner Type
Purchase Details
Closed on
Sep 7, 2018
Sold by
Light Ronald T
Bought by
Light Ronald T
Current Estimated Value
Purchase Details
Closed on
Dec 31, 2009
Sold by
Light May I and Light Inez
Bought by
Howard N & May Inez Light 2005 Trust
Purchase Details
Closed on
Dec 1, 2008
Sold by
Light Ronald T and Howard N & May Inez Light 2005
Bought by
Light May Inez
Home Financials for this Owner
Home Financials are based on the most recent Mortgage that was taken out on this home.
Original Mortgage
$200,000
Outstanding Balance
$131,567
Interest Rate
6.04%
Mortgage Type
New Conventional
Estimated Equity
$853,510
Purchase Details
Closed on
Jul 19, 2005
Sold by
Light Howard N and Light May Inez
Bought by
Howard N Light & May Inez Light 2005 Tr
Create a Home Valuation Report for This Property
The Home Valuation Report is an in-depth analysis detailing your home's value as well as a comparison with similar homes in the area
Home Values in the Area
Average Home Value in this Area
Purchase History
| Date | Buyer | Sale Price | Title Company |
|---|---|---|---|
| Light Ronald T | -- | None Available | |
| Light Ronald T | -- | None Available | |
| Howard N & May Inez Light 2005 Trust | -- | None Available | |
| Light May Inez | -- | Ticor Title | |
| Howard N Light & May Inez Light 2005 Tr | -- | -- |
Source: Public Records
Mortgage History
| Date | Status | Borrower | Loan Amount |
|---|---|---|---|
| Open | Light May Inez | $200,000 |
Source: Public Records
Tax History Compared to Growth
Tax History
| Year | Tax Paid | Tax Assessment Tax Assessment Total Assessment is a certain percentage of the fair market value that is determined by local assessors to be the total taxable value of land and additions on the property. | Land | Improvement |
|---|---|---|---|---|
| 2025 | $1,374 | $70,144 | $31,347 | $38,797 |
| 2024 | $1,374 | $68,770 | $30,733 | $38,037 |
| 2023 | $1,340 | $67,423 | $30,131 | $37,292 |
| 2022 | $1,224 | $66,102 | $29,541 | $36,561 |
| 2021 | $1,188 | $64,807 | $28,962 | $35,845 |
| 2019 | $1,172 | $62,887 | $28,104 | $34,783 |
| 2018 | $1,106 | $61,654 | $27,553 | $34,101 |
| 2017 | $1,084 | $60,446 | $27,013 | $33,433 |
| 2016 | $1,051 | $59,262 | $26,484 | $32,778 |
| 2015 | $1,042 | $58,373 | $26,087 | $32,286 |
| 2014 | $1,040 | $57,230 | $25,576 | $31,654 |
Source: Public Records
Map
Nearby Homes
- 4878 W 133rd St
- 5030 W 130th St
- 4813 W 130th St
- 5039 W 134th St
- 5116 W 130th St
- 4750 W 133rd St
- 4688 W 131st St
- 5126 W El Segundo Blvd
- 4622 W 131st St
- 12621 Costa Dr
- 5004 W 138th St
- 4653 W 137th Place
- 4487 W 131st St
- 5254 W 127th St
- 4474 W 133rd St
- 4526 W 136th St
- 4509 W 136th St Unit A & B
- 4748 W 140th St
- 4761 W 141st St
- 5048 W 121st St
- 13106 Shoup Ave
- 13100 Shoup Ave
- 4875 W 132nd St
- 4871 W 132nd St
- 4879 W 132nd St
- 4866 W 131st St
- 4872 W 131st St
- 4869 W 132nd St
- 4902 W 131st St
- 4865 W 132nd St
- 4901 W 132nd St
- 4860 W 131st St
- 4862 W 131st St
- 4906 W 131st St
- 4861 W 132nd St
- 4907 W 132nd St
- 4910 W 131st St
- 4856 W 131st St
- 4857 W 132nd St
- 4875 W 131st St