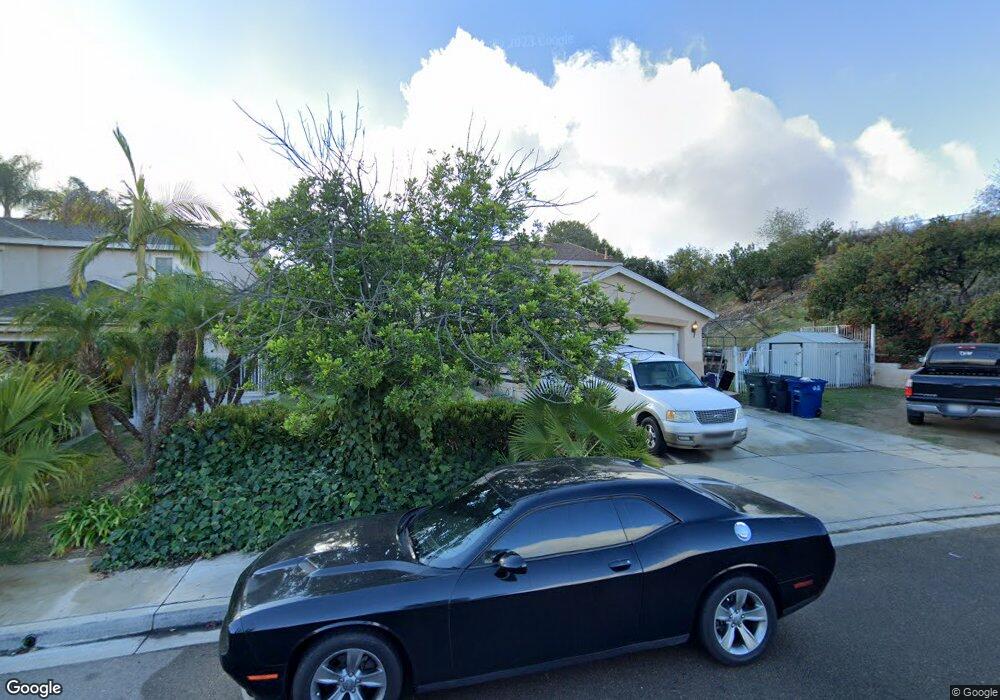
13111 Currant Ct Lakeside, CA 92040
Estimated Value: $996,000 - $1,244,000
5
Beds
3
Baths
3,105
Sq Ft
$347/Sq Ft
Est. Value
About This Home
This home is located at 13111 Currant Ct, Lakeside, CA 92040 and is currently estimated at $1,078,145, approximately $347 per square foot. 13111 Currant Ct is a home located in San Diego County with nearby schools including Lakeview Elementary School, Tierra Del Sol Middle School, and El Capitan High School.
Ownership History
Date
Name
Owned For
Owner Type
Purchase Details
Closed on
Jan 27, 2024
Sold by
Merkel Traci Clain
Bought by
Trust Agreement Of Traci Clain Merkel and Merkel
Current Estimated Value
Purchase Details
Closed on
Nov 13, 2009
Sold by
Merkel Traci C
Bought by
Merkel Traci C
Purchase Details
Closed on
Apr 2, 2009
Sold by
Merkel Traci C
Bought by
Merkel Traci C
Purchase Details
Closed on
Jun 21, 2005
Sold by
Merkel Randy C and Merkel Traci C
Bought by
Merkel Traci C
Home Financials for this Owner
Home Financials are based on the most recent Mortgage that was taken out on this home.
Original Mortgage
$251,000
Interest Rate
5.72%
Mortgage Type
Stand Alone Refi Refinance Of Original Loan
Purchase Details
Closed on
Jun 30, 1998
Sold by
Kaufman & Broad Of San Diego Inc
Bought by
Merkel Randy C and Merkel Traci C
Home Financials for this Owner
Home Financials are based on the most recent Mortgage that was taken out on this home.
Original Mortgage
$237,500
Interest Rate
7.03%
Create a Home Valuation Report for This Property
The Home Valuation Report is an in-depth analysis detailing your home's value as well as a comparison with similar homes in the area
Home Values in the Area
Average Home Value in this Area
Purchase History
| Date | Buyer | Sale Price | Title Company |
|---|---|---|---|
| Trust Agreement Of Traci Clain Merkel | -- | None Listed On Document | |
| Merkel Traci C | -- | None Available | |
| Merkel Traci C | -- | None Available | |
| Merkel Traci C | -- | Fidelity National Title | |
| Merkel Randy C | $264,000 | First American Title |
Source: Public Records
Mortgage History
| Date | Status | Borrower | Loan Amount |
|---|---|---|---|
| Previous Owner | Merkel Traci C | $251,000 | |
| Previous Owner | Merkel Randy C | $237,500 |
Source: Public Records
Tax History
| Year | Tax Paid | Tax Assessment Tax Assessment Total Assessment is a certain percentage of the fair market value that is determined by local assessors to be the total taxable value of land and additions on the property. | Land | Improvement |
|---|---|---|---|---|
| 2025 | $9,043 | $421,670 | $117,565 | $304,105 |
| 2024 | $9,043 | $413,403 | $115,260 | $298,143 |
| 2023 | $8,834 | $405,298 | $113,000 | $292,298 |
| 2022 | $8,728 | $397,352 | $110,785 | $286,567 |
| 2021 | $8,659 | $389,562 | $108,613 | $280,949 |
| 2020 | $8,520 | $385,569 | $107,500 | $278,069 |
| 2019 | $8,424 | $378,010 | $105,393 | $272,617 |
| 2018 | $8,313 | $370,599 | $103,327 | $267,272 |
| 2017 | $822 | $363,333 | $101,301 | $262,032 |
| 2016 | $4,760 | $356,210 | $99,315 | $256,895 |
| 2015 | $4,731 | $350,861 | $97,824 | $253,037 |
| 2014 | $4,515 | $343,989 | $95,908 | $248,081 |
Source: Public Records
Map
Nearby Homes
- 12886 Castle Court Dr
- 13256 W Lakeview Rd
- 12736 Castle Court Dr
- 12635 Castle Court Dr
- 9227 Colorama Way
- 9620 Los Coches Rd
- 12525 Julian Ave
- 13314 Lakeshore Dr
- 13451 Lakeshore Dr
- 9903 Lindo Lake Place
- 13403 Bubbling Ln
- 9810 Colt Ln
- 0 Los Coches Rd Unit 397-060-86-00
- 12403 Julian Ave Unit 206
- 10019 Tamil Rd
- 10025 Tamil Rd
- 12741 Laurel St Unit 34
- 12307 Lemon Crest Dr
- 10032 Tamil Rd
- 12650 Lakeshore Dr
- 13121 Currant Ct
- 13106 Morning Glory Dr
- 13110 Morning Glory Dr
- 13135 Currant Ct
- 13104 Currant Ct
- 13124 Morning Glory Dr
- 13120 Currant Ct
- 13112 Currant Ct
- 13143 Currant Ct
- 13134 Currant Ct
- 13132 Morning Glory Dr
- 13142 Currant Ct
- 13155 Currant Ct
- 13144 Morning Glory Dr
- 13150 Currant Ct
- 13105 Morning Glory Dr
- 13109 Morning Glory Dr
- 13150 Morning Glory Dr
- 13160 Currant Ct
- 13123 Morning Glory Dr
Your Personal Tour Guide
Ask me questions while you tour the home.