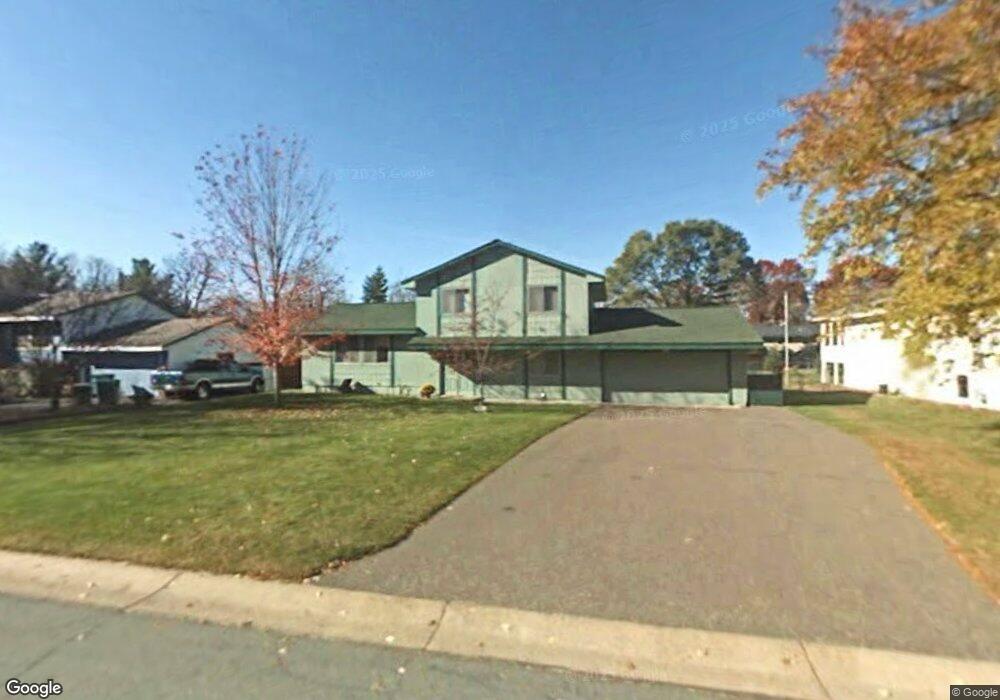
13118 Van Buren St NE Minneapolis, MN 55434
Estimated Value: $331,000 - $353,000
3
Beds
2
Baths
1,680
Sq Ft
$202/Sq Ft
Est. Value
About This Home
This home is located at 13118 Van Buren St NE, Minneapolis, MN 55434 and is currently estimated at $339,288, approximately $201 per square foot. 13118 Van Buren St NE is a home located in Anoka County with nearby schools including Johnsville Elementary School, Roosevelt Middle School, and Blaine Senior High School.
Ownership History
Date
Name
Owned For
Owner Type
Purchase Details
Closed on
May 27, 2021
Sold by
Opendoor Property J Llc
Bought by
Thao Kabao and Xiong Chang
Current Estimated Value
Home Financials for this Owner
Home Financials are based on the most recent Mortgage that was taken out on this home.
Original Mortgage
$270,750
Outstanding Balance
$245,130
Interest Rate
2.9%
Mortgage Type
New Conventional
Estimated Equity
$94,158
Purchase Details
Closed on
Nov 4, 2020
Sold by
Wangerin Tony P and Wangerin Patricia J
Bought by
Opendoor Property J Llc
Purchase Details
Closed on
Sep 23, 2015
Sold by
Sehm Robert Michael and Sehm Diane K
Bought by
Wangerin Tony P
Home Financials for this Owner
Home Financials are based on the most recent Mortgage that was taken out on this home.
Original Mortgage
$186,558
Interest Rate
4.25%
Mortgage Type
FHA
Create a Home Valuation Report for This Property
The Home Valuation Report is an in-depth analysis detailing your home's value as well as a comparison with similar homes in the area
Home Values in the Area
Average Home Value in this Area
Purchase History
| Date | Buyer | Sale Price | Title Company |
|---|---|---|---|
| Thao Kabao | $285,000 | North American Title Company | |
| Opendoor Property J Llc | $247,600 | Os National Llc | |
| Wangerin Tony P | $190,000 | Liberty Title Inc | |
| Thao Kabao Kabao | $285,000 | -- |
Source: Public Records
Mortgage History
| Date | Status | Borrower | Loan Amount |
|---|---|---|---|
| Open | Thao Kabao | $270,750 | |
| Previous Owner | Wangerin Tony P | $186,558 | |
| Closed | Thao Kabao Kabao | $270,750 |
Source: Public Records
Tax History Compared to Growth
Tax History
| Year | Tax Paid | Tax Assessment Tax Assessment Total Assessment is a certain percentage of the fair market value that is determined by local assessors to be the total taxable value of land and additions on the property. | Land | Improvement |
|---|---|---|---|---|
| 2025 | $3,017 | $287,700 | $110,000 | $177,700 |
| 2024 | $3,017 | $296,600 | $108,200 | $188,400 |
| 2023 | $2,635 | $294,000 | $100,000 | $194,000 |
| 2022 | $2,427 | $282,800 | $86,400 | $196,400 |
| 2021 | $2,398 | $234,300 | $75,000 | $159,300 |
| 2020 | $2,377 | $224,800 | $73,000 | $151,800 |
| 2019 | $2,184 | $217,300 | $68,300 | $149,000 |
| 2018 | $2,195 | $197,500 | $0 | $0 |
| 2017 | $1,827 | $211,600 | $0 | $0 |
| 2016 | $1,854 | $163,900 | $0 | $0 |
| 2015 | -- | $163,900 | $55,500 | $108,400 |
| 2014 | -- | $140,100 | $45,000 | $95,100 |
Source: Public Records
Map
Nearby Homes
- 13420 Van Buren St NE
- 755 134th Ln NE
- 12928 Jefferson St NE
- 1250 132nd Ln NE
- 13446 Buchanan St NE
- 13018 Ulysses St NE
- 1156 128th Ave NE
- 12980 Ulysses St NE
- 12630 Able Cir NE
- 110 132nd Ave NE
- 901 Bunker Lake Blvd NE
- 13649 Pierce St NE
- 1409 131st Ave NE
- 12775 Ulysses Cir NE
- 800 125th Ln NE
- 1132 Buchanan Cir NE
- 527 138th Ln NE
- 13907 Washington St NE
- 1756 132nd Ave NE
- 13929 Terrace Rd NE
- 13124 Van Buren St NE
- 13125 Jackson St NE
- 13200 Van Buren St NE
- 13106 Van Buren St NE
- 13131 Jackson St NE
- 13119 Jackson St NE
- 13113 Van Buren St NE
- 13119 Van Buren St NE
- 13201 Van Buren St NE
- 13201 Jackson St NE
- 13113 Jackson St NE
- 13206 Van Buren St NE
- 815 131st Ave NE
- 13101 Van Buren St NE
- 13207 Jackson St NE
- 13107 Jackson St NE
- 13207 Van Buren St NE
- 13112 Able St NE
- 13212 Van Buren St NE
- 13118 Able St NE