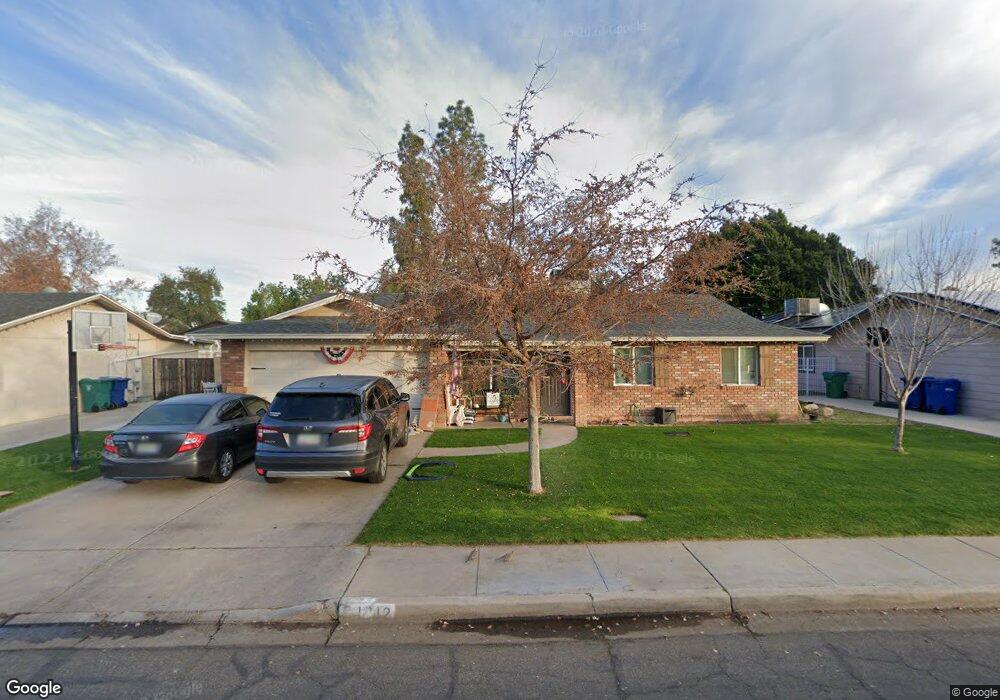
1312 E Hale St Mesa, AZ 85203
North Central Mesa NeighborhoodEstimated Value: $378,462 - $460,000
Studio
2
Baths
1,620
Sq Ft
$262/Sq Ft
Est. Value
About This Home
This home is located at 1312 E Hale St, Mesa, AZ 85203 and is currently estimated at $424,366, approximately $261 per square foot. 1312 E Hale St is a home located in Maricopa County with nearby schools including Macarthur Elementary School, Franklin at Brimhall Elementary School, and Franklin West Elementary School.
Ownership History
Date
Name
Owned For
Owner Type
Purchase Details
Closed on
Oct 24, 2022
Sold by
Rogers Cindy B
Bought by
Rogers Cindy B and Pedersen Brandon
Current Estimated Value
Purchase Details
Closed on
May 23, 2013
Sold by
Rogers Cindy B and Rogers Renny
Bought by
Rogers Cindy B
Home Financials for this Owner
Home Financials are based on the most recent Mortgage that was taken out on this home.
Original Mortgage
$75,500
Interest Rate
3.38%
Mortgage Type
New Conventional
Purchase Details
Closed on
Oct 29, 1998
Sold by
Cross Robert L and Cross Norleen R S
Bought by
Pedersen Cindy B
Home Financials for this Owner
Home Financials are based on the most recent Mortgage that was taken out on this home.
Original Mortgage
$94,000
Interest Rate
6.42%
Create a Home Valuation Report for This Property
The Home Valuation Report is an in-depth analysis detailing your home's value as well as a comparison with similar homes in the area
Home Values in the Area
Average Home Value in this Area
Purchase History
| Date | Buyer | Sale Price | Title Company |
|---|---|---|---|
| Rogers Cindy B | -- | -- | |
| Rogers Cindy B | -- | None Available | |
| Pedersen Cindy B | -- | -- |
Source: Public Records
Mortgage History
| Date | Status | Borrower | Loan Amount |
|---|---|---|---|
| Previous Owner | Rogers Cindy B | $75,500 | |
| Previous Owner | Pedersen Cindy B | $94,000 |
Source: Public Records
Tax History
| Year | Tax Paid | Tax Assessment Tax Assessment Total Assessment is a certain percentage of the fair market value that is determined by local assessors to be the total taxable value of land and additions on the property. | Land | Improvement |
|---|---|---|---|---|
| 2025 | $1,509 | $18,174 | -- | -- |
| 2024 | $1,526 | $17,309 | -- | -- |
| 2023 | $1,526 | $33,780 | $6,750 | $27,030 |
| 2022 | $1,492 | $24,960 | $4,990 | $19,970 |
| 2021 | $1,533 | $22,700 | $4,540 | $18,160 |
| 2020 | $1,513 | $21,070 | $4,210 | $16,860 |
| 2019 | $1,401 | $19,050 | $3,810 | $15,240 |
| 2018 | $1,338 | $17,300 | $3,460 | $13,840 |
| 2017 | $1,296 | $16,880 | $3,370 | $13,510 |
| 2016 | $1,273 | $16,020 | $3,200 | $12,820 |
| 2015 | $1,201 | $13,810 | $2,760 | $11,050 |
Source: Public Records
Map
Nearby Homes
- 1324 E Hale St
- 1550 N Stapley Dr Unit 15
- 1550 N Stapley Dr Unit 48
- 1304 E Hackamore St
- 1365 N Diane Cir
- 1762 N Barkley
- 1232 E Granada St
- 1146 E Jensen St
- 1116 E Hackamore St
- 1836 N Stapley Dr Unit 3
- 1836 N Stapley Dr Unit 136
- 1335 E June St Unit 239
- 1335 E June St Unit 202
- 1204 E Glencove Cir
- 1202 E Greenway Cir
- 1737 N Fraser Dr
- 928 E Hope St Unit 1E
- 1837 N Daley
- 953 E Hackamore St
- 1650 E Grandview St
- 1318 E Hale St
- 1304 E Hale St
- 1313 E Mclellan Rd
- 1305 E Mclellan Rd
- 1305 E Mclellan Rd
- 1319 E Mclellan Rd
- 1319 E Mclellan Rd
- 1262 E Hale St
- 1311 E Hale St
- 1303 E Hale St
- 1325 E Mclellan Rd
- 1263 E Mclellan Rd
- 1323 E Hale St
- 1261 E Hale St
- 1254 E Hale St
- 1334 E Hale St
- 1335 E Mclellan Rd
- 1255 E Mclellan Rd
- 1310 E Halifax St
- 1333 E Hale St
Your Personal Tour Guide
Ask me questions while you tour the home.