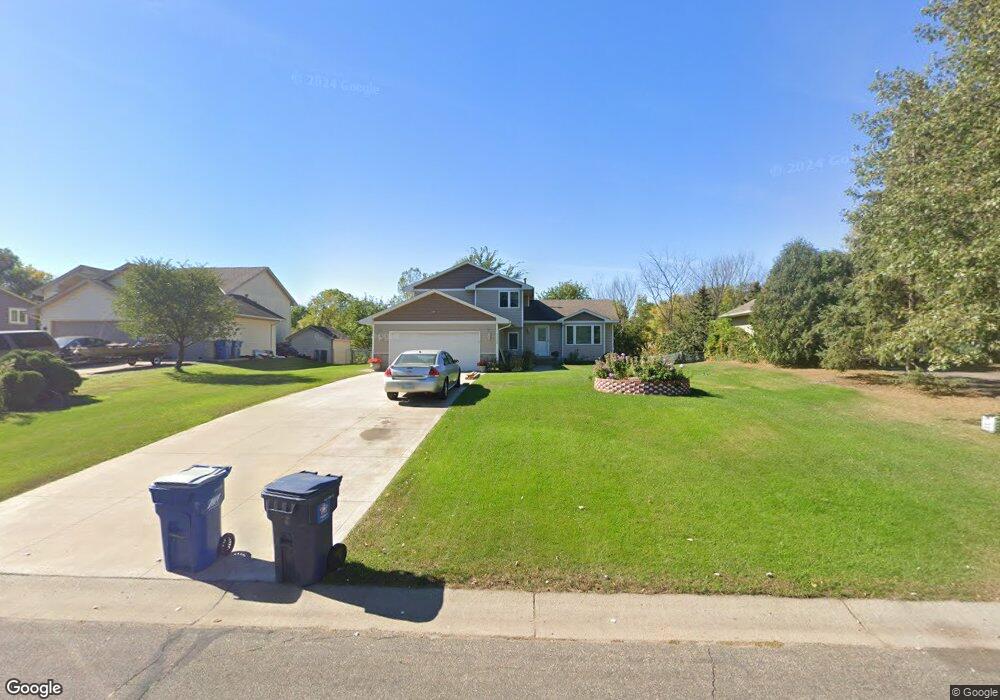
1312 Independence Ave N Champlin, MN 55316
Estimated Value: $368,000 - $434,000
4
Beds
2
Baths
1,772
Sq Ft
$227/Sq Ft
Est. Value
About This Home
This home is located at 1312 Independence Ave N, Champlin, MN 55316 and is currently estimated at $402,500, approximately $227 per square foot. 1312 Independence Ave N is a home located in Hennepin County with nearby schools including Champlin-Brooklyn Park Academy, Jackson Middle School, and Champlin Park High School.
Ownership History
Date
Name
Owned For
Owner Type
Purchase Details
Closed on
May 17, 2017
Sold by
Vanluong Liey
Bought by
Vanluong Leiu and Nguyen Hiedthi
Current Estimated Value
Purchase Details
Closed on
Sep 30, 2015
Sold by
Vongsaly Chanthachone and Vongsaly Oudone
Bought by
Luong Lieu
Home Financials for this Owner
Home Financials are based on the most recent Mortgage that was taken out on this home.
Original Mortgage
$172,000
Outstanding Balance
$67,453
Interest Rate
3.11%
Mortgage Type
New Conventional
Estimated Equity
$335,047
Purchase Details
Closed on
Jan 7, 2011
Sold by
Bank Of America Na
Bought by
Vongsaly Chanthachone and Not Provided
Create a Home Valuation Report for This Property
The Home Valuation Report is an in-depth analysis detailing your home's value as well as a comparison with similar homes in the area
Home Values in the Area
Average Home Value in this Area
Purchase History
| Date | Buyer | Sale Price | Title Company |
|---|---|---|---|
| Vanluong Leiu | -- | None Available | |
| Luong Lieu | $215,000 | Edina Realty Title Inc | |
| Vongsaly Chanthachone | $169,000 | -- |
Source: Public Records
Mortgage History
| Date | Status | Borrower | Loan Amount |
|---|---|---|---|
| Open | Luong Lieu | $172,000 |
Source: Public Records
Tax History
| Year | Tax Paid | Tax Assessment Tax Assessment Total Assessment is a certain percentage of the fair market value that is determined by local assessors to be the total taxable value of land and additions on the property. | Land | Improvement |
|---|---|---|---|---|
| 2024 | $4,411 | $378,600 | $95,700 | $282,900 |
| 2023 | $4,377 | $383,500 | $97,900 | $285,600 |
| 2022 | $3,559 | $358,000 | $86,000 | $272,000 |
| 2021 | $3,336 | $291,000 | $72,000 | $219,000 |
| 2020 | $3,321 | $273,000 | $62,000 | $211,000 |
| 2019 | $3,268 | $266,000 | $64,000 | $202,000 |
| 2018 | $2,990 | $258,000 | $54,000 | $204,000 |
| 2017 | $2,705 | $213,000 | $40,000 | $173,000 |
| 2016 | $2,658 | $203,000 | $46,000 | $157,000 |
| 2015 | $2,591 | $198,000 | $41,000 | $157,000 |
| 2014 | -- | $185,000 | $44,000 | $141,000 |
Source: Public Records
Map
Nearby Homes
- 126 Hayden Lake Rd E
- 969 Creekwood Dr N
- 1032 Orleans Ln N
- 704 Keniston St N
- 8424 Yukon Cir N
- 11916 Emery Village Dr N
- 11907 Emery Village Dr N
- 809 Bradford Ave
- 11875 Emery Village Dr N Unit 2503
- 413 Orleans Ct N
- 8333 Emery Pkwy N
- 1147 5th Ave
- 516 Dayton Rd
- 701 Parkview Ln
- 11492 Elmwood Ave N
- 10300 Parkview Ln
- 1500 Quebec Ave N
- 11421 Elmwood Ave N Unit 9
- 7809 119th Ave N
- 11404 Rosemill Ct
- 1314 Independence Ave N
- 1310 Independence Ave N
- 1316 Independence Ave N
- 1309 Independence Ave N
- 1306 Independence Ave N
- 1305 Independence Ave N
- 1313 Independence Ave N
- 1301 Independence Ave N
- 117 Independence Ct N
- 1317 Independence Ave N
- 106 Independence Ct N
- 1222 Independence Ave N
- 110 Independence Ct N
- 114 Independence Ct N
- 1235 Cartway Rd N
- 1235 Cartway Rd N
- 1321 Independence Ave N
- 118 Independence Ct N
- 1239 Cartway Rd N
- 1390 Cobblestone Rd N
Your Personal Tour Guide
Ask me questions while you tour the home.