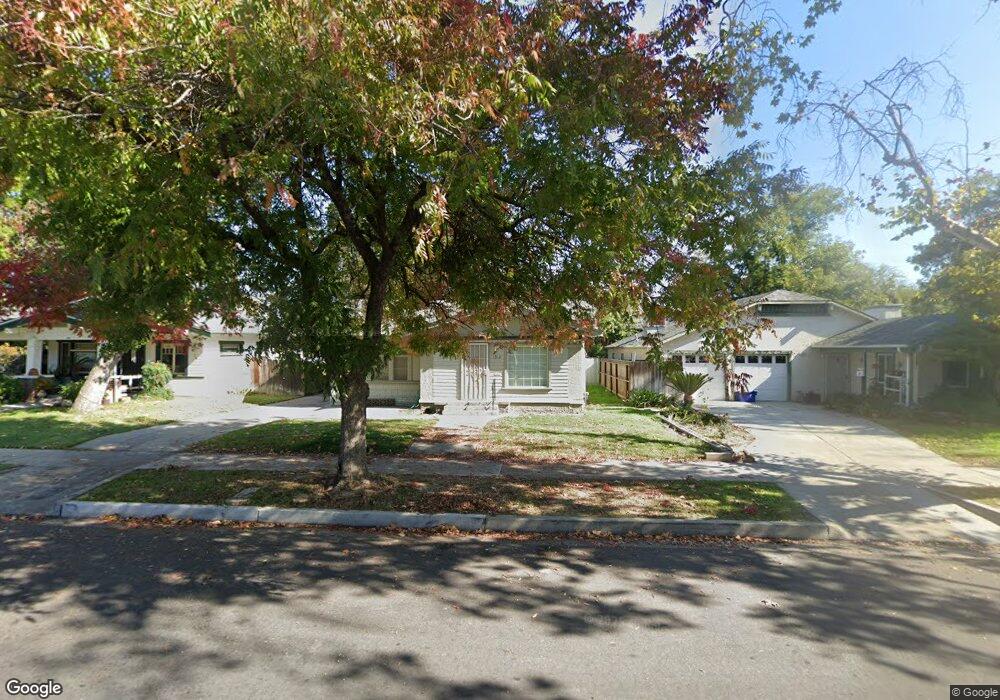
1312 N Lucerne Ln Fresno, CA 93728
Tower District NeighborhoodEstimated Value: $233,833 - $335,000
1
Bed
1
Bath
1,178
Sq Ft
$239/Sq Ft
Est. Value
About This Home
This home is located at 1312 N Lucerne Ln, Fresno, CA 93728 and is currently estimated at $280,958, approximately $238 per square foot. 1312 N Lucerne Ln is a home located in Fresno County with nearby schools including Muir Elementary, Fort Miller Middle School, and Fresno High School.
Ownership History
Date
Name
Owned For
Owner Type
Purchase Details
Closed on
Apr 26, 2004
Sold by
Ward Diana E and Stenson Diana E
Bought by
Ward Diana E
Current Estimated Value
Home Financials for this Owner
Home Financials are based on the most recent Mortgage that was taken out on this home.
Original Mortgage
$107,934
Outstanding Balance
$60,503
Interest Rate
8.37%
Mortgage Type
New Conventional
Estimated Equity
$220,455
Purchase Details
Closed on
Oct 23, 1998
Sold by
Sorge John D and Sorge Patricia J
Bought by
Stenson Diana E
Home Financials for this Owner
Home Financials are based on the most recent Mortgage that was taken out on this home.
Original Mortgage
$50,102
Interest Rate
6.54%
Mortgage Type
FHA
Purchase Details
Closed on
Sep 27, 1994
Sold by
Sorge John D and Sorge Patricia J
Bought by
Sorge John D and Sorge Patricia J
Create a Home Valuation Report for This Property
The Home Valuation Report is an in-depth analysis detailing your home's value as well as a comparison with similar homes in the area
Home Values in the Area
Average Home Value in this Area
Purchase History
| Date | Buyer | Sale Price | Title Company |
|---|---|---|---|
| Ward Diana E | -- | Chicago Title Company | |
| Stenson Diana E | $58,000 | Fidelity National Title Co | |
| Sorge John D | -- | -- |
Source: Public Records
Mortgage History
| Date | Status | Borrower | Loan Amount |
|---|---|---|---|
| Open | Ward Diana E | $107,934 | |
| Closed | Stenson Diana E | $50,102 | |
| Closed | Ward Diana E | $10,000 |
Source: Public Records
Tax History Compared to Growth
Tax History
| Year | Tax Paid | Tax Assessment Tax Assessment Total Assessment is a certain percentage of the fair market value that is determined by local assessors to be the total taxable value of land and additions on the property. | Land | Improvement |
|---|---|---|---|---|
| 2025 | $1,121 | $90,895 | $31,340 | $59,555 |
| 2023 | $1,056 | $87,368 | $30,124 | $57,244 |
| 2022 | $1,040 | $85,656 | $29,534 | $56,122 |
| 2021 | $1,011 | $83,977 | $28,955 | $55,022 |
| 2020 | $1,005 | $83,117 | $28,659 | $54,458 |
| 2019 | $966 | $81,489 | $28,098 | $53,391 |
| 2018 | $944 | $79,893 | $27,548 | $52,345 |
| 2017 | $927 | $78,327 | $27,008 | $51,319 |
| 2016 | $895 | $76,792 | $26,479 | $50,313 |
| 2015 | $881 | $75,640 | $26,082 | $49,558 |
| 2014 | $861 | $74,160 | $25,572 | $48,588 |
Source: Public Records
Map
Nearby Homes
- 1371 N Roosevelt Ave
- 1271 N Roosevelt Ave
- 1487 N Echo Ave
- 1317 N Wilson Ave
- 721 E Home Ave
- 605 E Home Ave
- 745 E Home Ave
- 1327 N Ferger Ave
- 1504 N Van Ness Ave
- 1010 N Ferger Ave
- 1592 N Ferger Ave
- 1452 N Poplar Ave
- 930 N Roosevelt Ave
- 630 E Dudley Ave
- 807 N Van Ness Ave
- 1334 N Glenn Ave
- 630 N Roosevelt Ave
- 1105 E Bremer Ave
- 1303 N Calaveras St
- 0 W Olive Ave Unit 633534
- 1304 N Lucerne Ln
- 1320 N Lucerne Ln
- 662 E Hedges Ave
- 1296 N Lucerne Ln
- 1286 N Lucerne Ln
- 1293 N Linden Ave
- 1307 N Linden Ave
- 1291 N Linden Ave
- 1309 N Lucerne Ln
- 1278 N Lucerne Ln
- 645 E Hedges Ave
- 657 E Hedges Ave
- 1301 N Lucerne Ln
- 626 E Hedges Ave
- 1285 N Linden Ave
- 1293 N Lucerne Ln
- 1329 N Linden Ave
- 1283 N Lucerne Ln
- 1270 N Lucerne Ln
- 1275 N Linden Ave