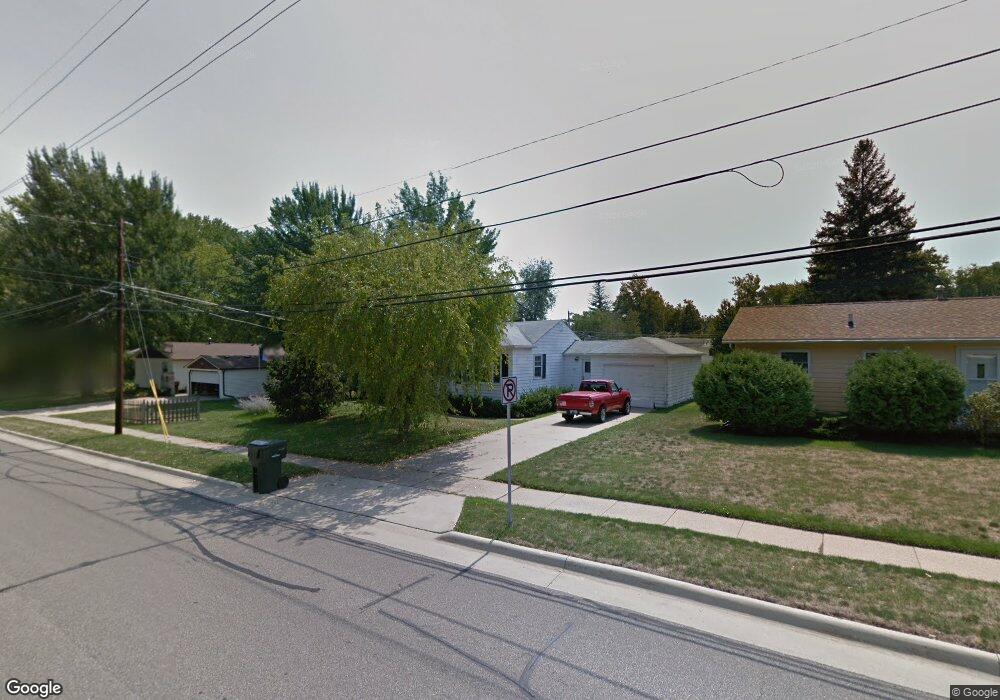
1312 W 4th St Cedar Falls, IA 50613
Estimated Value: $186,000 - $195,000
3
Beds
1
Bath
934
Sq Ft
$204/Sq Ft
Est. Value
About This Home
This home is located at 1312 W 4th St, Cedar Falls, IA 50613 and is currently estimated at $190,853, approximately $204 per square foot. 1312 W 4th St is a home located in Black Hawk County with nearby schools including Lincoln Elementary School, Holmes Junior High School, and Cedar Falls High School.
Ownership History
Date
Name
Owned For
Owner Type
Purchase Details
Closed on
Sep 30, 2019
Sold by
Sre Holdings Llc
Bought by
Flannery Jim and Flannery Juilet
Current Estimated Value
Home Financials for this Owner
Home Financials are based on the most recent Mortgage that was taken out on this home.
Original Mortgage
$22,110
Outstanding Balance
$14,625
Interest Rate
3.5%
Mortgage Type
Unknown
Estimated Equity
$176,228
Purchase Details
Closed on
Mar 15, 2018
Sold by
Morrow Victor E
Bought by
Sre Holdings Llc
Create a Home Valuation Report for This Property
The Home Valuation Report is an in-depth analysis detailing your home's value as well as a comparison with similar homes in the area
Home Values in the Area
Average Home Value in this Area
Purchase History
| Date | Buyer | Sale Price | Title Company |
|---|---|---|---|
| Flannery Jim | -- | -- | |
| Sre Holdings Llc | $44,500 | -- |
Source: Public Records
Mortgage History
| Date | Status | Borrower | Loan Amount |
|---|---|---|---|
| Open | Flannery Jim | $22,110 | |
| Open | Flannery Jim | $107,200 |
Source: Public Records
Tax History Compared to Growth
Tax History
| Year | Tax Paid | Tax Assessment Tax Assessment Total Assessment is a certain percentage of the fair market value that is determined by local assessors to be the total taxable value of land and additions on the property. | Land | Improvement |
|---|---|---|---|---|
| 2025 | $2,402 | $181,650 | $47,330 | $134,320 |
| 2024 | $2,402 | $159,460 | $30,430 | $129,030 |
| 2023 | $2,380 | $159,460 | $30,430 | $129,030 |
| 2022 | $2,410 | $128,940 | $30,430 | $98,510 |
| 2021 | $2,244 | $128,940 | $30,430 | $98,510 |
| 2020 | $2,200 | $120,490 | $21,980 | $98,510 |
| 2019 | $2,200 | $120,490 | $21,980 | $98,510 |
| 2018 | $2,028 | $109,750 | $21,980 | $87,770 |
| 2017 | $2,072 | $109,750 | $21,980 | $87,770 |
| 2016 | $1,940 | $109,750 | $21,980 | $87,770 |
| 2015 | $1,940 | $109,750 | $21,980 | $87,770 |
| 2014 | $1,890 | $105,760 | $21,980 | $83,780 |
Source: Public Records
Map
Nearby Homes