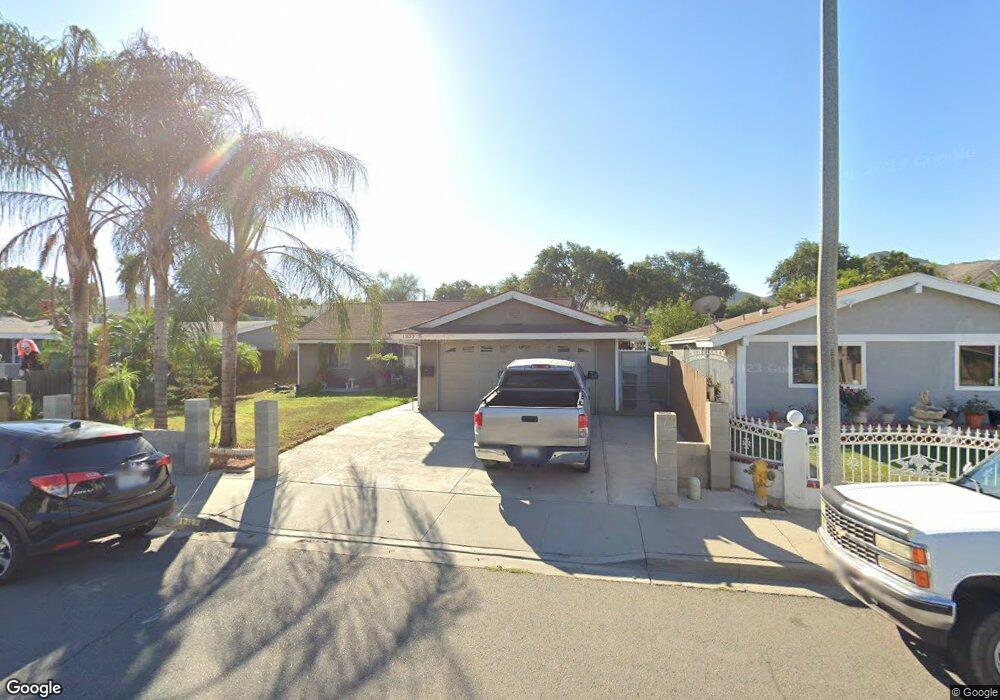
13122 Gatehall Ave Corona, CA 92879
Estimated Value: $590,115 - $634,000
4
Beds
2
Baths
1,235
Sq Ft
$497/Sq Ft
Est. Value
About This Home
This home is located at 13122 Gatehall Ave, Corona, CA 92879 and is currently estimated at $613,279, approximately $496 per square foot. 13122 Gatehall Ave is a home located in Riverside County with nearby schools including Home Gardens Academy, Citrus Hills Intermediate School, and Santiago High School.
Ownership History
Date
Name
Owned For
Owner Type
Purchase Details
Closed on
May 29, 1998
Sold by
Correa Heriberto and Correa Alanna
Bought by
Torres Jose and Torres Evelia
Current Estimated Value
Home Financials for this Owner
Home Financials are based on the most recent Mortgage that was taken out on this home.
Original Mortgage
$113,344
Outstanding Balance
$22,912
Interest Rate
7.17%
Mortgage Type
FHA
Estimated Equity
$590,367
Purchase Details
Closed on
Jul 12, 1994
Sold by
Hud
Bought by
Correa Heriberto and Correa Alanna
Home Financials for this Owner
Home Financials are based on the most recent Mortgage that was taken out on this home.
Original Mortgage
$96,196
Interest Rate
8.65%
Mortgage Type
FHA
Purchase Details
Closed on
Mar 10, 1994
Sold by
Fleet Real Estate Funding Corp
Bought by
Hud
Create a Home Valuation Report for This Property
The Home Valuation Report is an in-depth analysis detailing your home's value as well as a comparison with similar homes in the area
Home Values in the Area
Average Home Value in this Area
Purchase History
| Date | Buyer | Sale Price | Title Company |
|---|---|---|---|
| Torres Jose | $114,000 | First American Title Ins Co | |
| Correa Heriberto | $98,000 | World Title | |
| Hud | -- | First Southwestern Title Co | |
| Fleet Real Estate Funding Corp | $140,123 | First Southwestern Title Co |
Source: Public Records
Mortgage History
| Date | Status | Borrower | Loan Amount |
|---|---|---|---|
| Open | Torres Jose | $113,344 | |
| Previous Owner | Correa Heriberto | $96,196 |
Source: Public Records
Tax History Compared to Growth
Tax History
| Year | Tax Paid | Tax Assessment Tax Assessment Total Assessment is a certain percentage of the fair market value that is determined by local assessors to be the total taxable value of land and additions on the property. | Land | Improvement |
|---|---|---|---|---|
| 2025 | $1,980 | $181,994 | $63,847 | $118,147 |
| 2023 | $1,980 | $174,929 | $61,369 | $113,560 |
| 2022 | $1,913 | $171,500 | $60,166 | $111,334 |
| 2021 | $1,873 | $168,138 | $58,987 | $109,151 |
| 2020 | $1,851 | $166,415 | $58,383 | $108,032 |
| 2019 | $1,807 | $163,153 | $57,239 | $105,914 |
| 2018 | $1,765 | $159,955 | $56,118 | $103,837 |
| 2017 | $1,721 | $156,819 | $55,018 | $101,801 |
| 2016 | $1,703 | $153,745 | $53,940 | $99,805 |
| 2015 | $1,664 | $151,437 | $53,131 | $98,306 |
| 2014 | $1,602 | $148,473 | $52,092 | $96,381 |
Source: Public Records
Map
Nearby Homes
- 3461 Crownsworth St
- 3577 Briarvale St
- 3638 Candlewood St
- 13099 Reindeer Ct
- 3653 Briarvale St
- 3631 Snowdrift Dr
- 3627 Windstorm Way
- 13022 April Dr
- 13015 New Haven Loop
- 13042 Avenida Pescador
- 3728 Via Tortola
- 3306 July Dr
- 13653 Magnolia Ave
- 12911 Via Napoi
- 13006 August Cir
- 13355 February Dr
- 2373 Lily Ct
- 13381 Magnolia Ave Unit 102
- 13381 Magnolia Ave Unit 168
- 3771 Harvill Ln
- 13116 Gatehall Ave
- 13130 Gatehall Ave
- 13136 Gatehall Ave
- 13108 Gatehall Ave
- 13137 Cliffshire Ave
- 13119 Cliffshire Ave
- 13147 Cliffshire Ave
- 13121 Gatehall Ave
- 13111 Cliffshire Ave
- 13144 Gatehall Ave
- 13129 Gatehall Ave
- 13115 Gatehall Ave
- 13104 Gatehall Ave
- 13135 Gatehall Ave
- 13107 Gatehall Ave
- 13157 Cliffshire Ave
- 13101 Cliffshire Ave
- 13154 Gatehall Ave
- 13143 Gatehall Ave
- 13103 Gatehall Ave