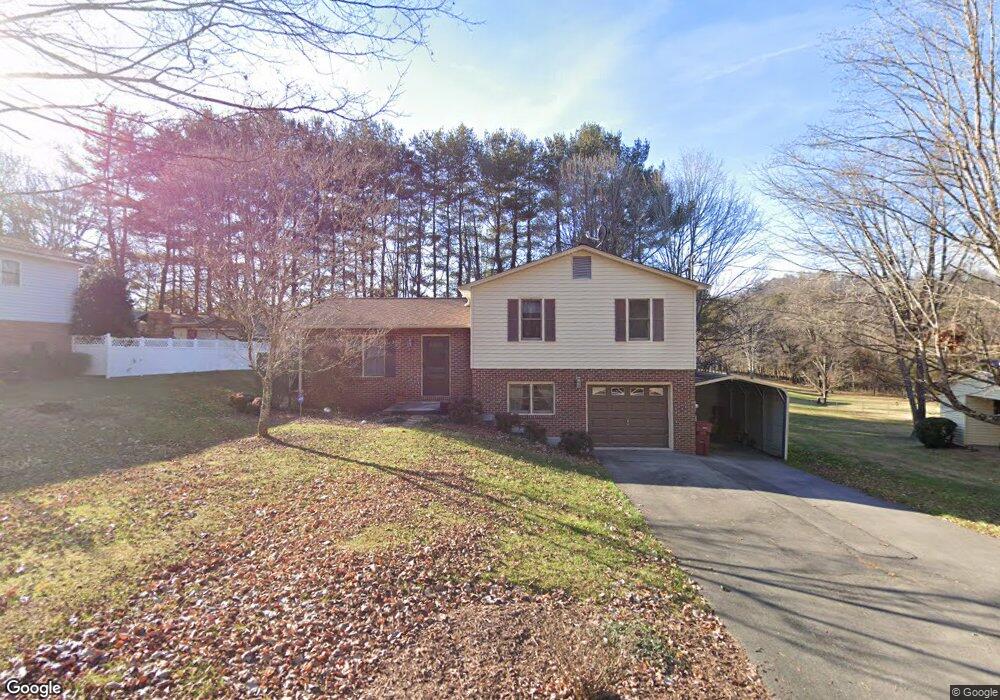
1313 Adobe Dr Johnson City, TN 37601
Estimated Value: $210,000 - $252,219
Studio
2
Baths
1,104
Sq Ft
$204/Sq Ft
Est. Value
About This Home
This home is located at 1313 Adobe Dr, Johnson City, TN 37601 and is currently estimated at $225,555, approximately $204 per square foot. 1313 Adobe Dr is a home located in Washington County with nearby schools including Fairmont Elementary School, Indian Trail Middle School, and Science Hill High School.
Ownership History
Date
Name
Owned For
Owner Type
Purchase Details
Closed on
Nov 15, 2023
Sold by
Lavinder Development Inc
Bought by
Nelson Adam T
Current Estimated Value
Home Financials for this Owner
Home Financials are based on the most recent Mortgage that was taken out on this home.
Original Mortgage
$171,000
Outstanding Balance
$167,423
Interest Rate
7.49%
Mortgage Type
New Conventional
Estimated Equity
$58,133
Purchase Details
Closed on
Jul 24, 2023
Sold by
Garland Arlie W and Garland Wilma J
Bought by
Lavinder Development Inc
Home Financials for this Owner
Home Financials are based on the most recent Mortgage that was taken out on this home.
Original Mortgage
$202,000
Interest Rate
6.71%
Mortgage Type
New Conventional
Purchase Details
Closed on
Oct 5, 2016
Sold by
Garland Arlie Wayne
Bought by
Garland Arlie and Garland Wilma
Purchase Details
Closed on
Oct 4, 1983
Bought by
Garland Arlie Wayne and Garland Wilma Joyce
Create a Home Valuation Report for This Property
The Home Valuation Report is an in-depth analysis detailing your home's value as well as a comparison with similar homes in the area
Purchase History
| Date | Buyer | Sale Price | Title Company |
|---|---|---|---|
| Nelson Adam T | $180,000 | None Listed On Document | |
| Lavinder Development Inc | $155,000 | None Listed On Document | |
| Garland Arlie | -- | -- | |
| Garland Arlie Wayne | $50,300 | -- |
Source: Public Records
Mortgage History
| Date | Status | Borrower | Loan Amount |
|---|---|---|---|
| Open | Nelson Adam T | $171,000 | |
| Previous Owner | Lavinder Development Inc | $202,000 |
Source: Public Records
Tax History
| Year | Tax Paid | Tax Assessment Tax Assessment Total Assessment is a certain percentage of the fair market value that is determined by local assessors to be the total taxable value of land and additions on the property. | Land | Improvement |
|---|---|---|---|---|
| 2025 | $847 | $49,550 | $9,000 | $40,550 |
| 2024 | $847 | $49,550 | $9,000 | $40,550 |
| 2023 | $725 | $33,725 | $0 | $0 |
| 2022 | $714 | $33,225 | $9,000 | $24,225 |
| 2021 | $1,289 | $33,225 | $9,000 | $24,225 |
| 2020 | $1,282 | $33,225 | $9,000 | $24,225 |
| 2019 | $701 | $33,225 | $9,000 | $24,225 |
| 2018 | $1,258 | $29,475 | $6,200 | $23,275 |
| 2017 | $1,258 | $29,475 | $6,200 | $23,275 |
| 2016 | $1,252 | $29,475 | $6,200 | $23,275 |
| 2015 | $1,061 | $29,475 | $6,200 | $23,275 |
| 2014 | $1,061 | $29,475 | $6,200 | $23,275 |
Source: Public Records
Map
Nearby Homes
- 2610 Austin Village Blvd
- 0 S Austin Springs Rd Unit 9984723
- 176 S Austin Springs Rd Unit 4
- 1093 Traders Walk
- 1091 Traders Walk
- 2809 Oak Cliff Ct
- 326 Hickory Bluff Unit 326
- 323 Hickory Bluff
- 316 Hickory Bluff
- Tbd E Oakland Ave and Princeton
- 217 Knob Creek Boat Dock Rd Unit LOT 24
- 2734 E Oakland Ave Unit 39
- 2734 E Oakland Ave Unit D33
- 500 Sunnyvale Dr
- 111 Tree Top Ln Unit 111
- 2509 E Lakeview Dr Unit 5
- 1914 E Oakland Ave
- 932 E Mountain View Rd
- 134 Tucker Ln
- 4160 Bristol Hwy Unit 602
- 1311 Adobe Dr
- 1315 Adobe Dr
- 1312 Cobblestone Ct
- 1314 Cobblestone Ct
- 1309 Adobe Dr
- 1310 Cobblestone Ct
- 1312 Adobe Dr
- 1311 Cobblestone Ct
- 1307 Adobe Dr
- 2701 Adobe Dr
- 1308 Cobblestone Ct
- 1309 Cobblestone Ct
- 1305 Adobe Dr
- 1306 Adobe Dr
- 1307 Cobblestone Ct
- 1306 Cobblestone Ct
- 1304 Cobblestone Ct
- 1304 Adobe Dr
- 1303 Adobe Dr
- 1302 Cobblestone Ct
Your Personal Tour Guide
Ask me questions while you tour the home.