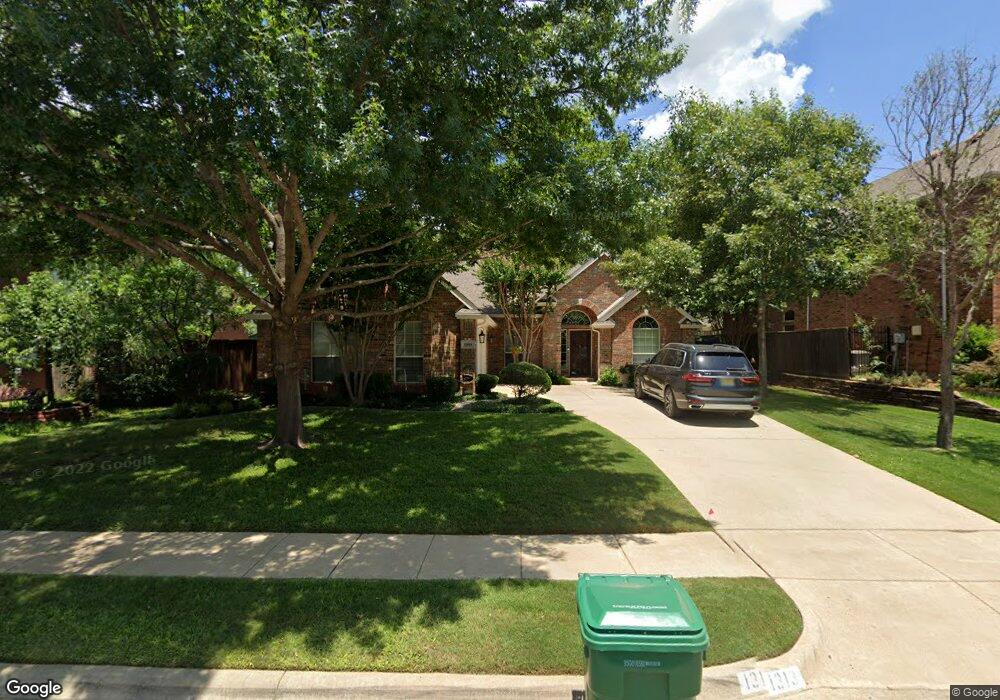
1313 Buena Vista Dr Denton, TX 76210
South Denton NeighborhoodEstimated Value: $383,616 - $417,000
3
Beds
2
Baths
2,228
Sq Ft
$178/Sq Ft
Est. Value
About This Home
This home is located at 1313 Buena Vista Dr, Denton, TX 76210 and is currently estimated at $395,904, approximately $177 per square foot. 1313 Buena Vista Dr is a home located in Denton County with nearby schools including McNair Elementary School, Crownover Middle School, and Guyer High School.
Ownership History
Date
Name
Owned For
Owner Type
Purchase Details
Closed on
May 15, 2012
Sold by
Lopez Enrique H and Lopez Jennifer
Bought by
York Lisa D
Current Estimated Value
Home Financials for this Owner
Home Financials are based on the most recent Mortgage that was taken out on this home.
Original Mortgage
$169,955
Outstanding Balance
$116,914
Interest Rate
3.9%
Mortgage Type
New Conventional
Estimated Equity
$278,990
Purchase Details
Closed on
Jul 27, 2007
Sold by
Lopez Enrique H
Bought by
Gates Jennifer L
Purchase Details
Closed on
Dec 8, 2004
Sold by
Kimball Hill Homes Texas Inc
Bought by
Lopez Enrique H
Home Financials for this Owner
Home Financials are based on the most recent Mortgage that was taken out on this home.
Original Mortgage
$155,679
Interest Rate
5.64%
Mortgage Type
FHA
Purchase Details
Closed on
Jan 27, 1999
Sold by
Gossett Craig
Bought by
Vista Verde I Llp
Create a Home Valuation Report for This Property
The Home Valuation Report is an in-depth analysis detailing your home's value as well as a comparison with similar homes in the area
Home Values in the Area
Average Home Value in this Area
Purchase History
| Date | Buyer | Sale Price | Title Company |
|---|---|---|---|
| York Lisa D | -- | Multiple | |
| Gates Jennifer L | -- | None Available | |
| Lopez Enrique H | -- | Stewart Title | |
| Vista Verde I Llp | -- | -- | |
| Vista Verde I Llp | -- | -- |
Source: Public Records
Mortgage History
| Date | Status | Borrower | Loan Amount |
|---|---|---|---|
| Open | York Lisa D | $169,955 | |
| Previous Owner | Lopez Enrique H | $155,679 |
Source: Public Records
Tax History Compared to Growth
Tax History
| Year | Tax Paid | Tax Assessment Tax Assessment Total Assessment is a certain percentage of the fair market value that is determined by local assessors to be the total taxable value of land and additions on the property. | Land | Improvement |
|---|---|---|---|---|
| 2025 | $2,211 | $379,801 | $94,090 | $285,711 |
| 2024 | $7,194 | $372,709 | $0 | $0 |
| 2023 | $2,217 | $338,826 | $94,090 | $309,732 |
| 2022 | $6,539 | $308,024 | $82,329 | $261,250 |
| 2021 | $6,225 | $280,022 | $61,159 | $218,863 |
| 2020 | $5,951 | $260,375 | $61,159 | $199,216 |
| 2019 | $6,175 | $258,794 | $61,159 | $197,635 |
| 2018 | $6,153 | $254,723 | $49,397 | $205,326 |
| 2017 | $5,778 | $233,765 | $49,397 | $184,368 |
| 2016 | $5,431 | $219,711 | $49,397 | $172,279 |
| 2015 | $4,414 | $199,737 | $49,397 | $150,340 |
| 2014 | $4,414 | $187,048 | $40,929 | $146,119 |
| 2013 | -- | $174,072 | $40,929 | $133,143 |
Source: Public Records
Map
Nearby Homes
- 1201 Buena Vista Dr
- 1605 Cordero Ct
- 1617 Glendora Ct
- 1612 Marble Cove Ln
- 7804 Hidden Path Ln
- 1217 Golden Sand Dr
- 7305 Mira Vista Dr
- 7912 Hidden Path Ln
- 7301 Chaucer Dr
- 7620 Waterside Place
- 7100 Frost Ln
- 2109 Doecrest Dr
- 8404 Glen Falls Ln
- 7121 Raintree Way
- 2109 Hemingway Dr
- 1917 Prescott Downs Dr
- 1917 Belmont Park Dr
- 8704 Serenity Way
- 1517 Miranda Ln
- 2005 Creekdale Dr
- 1401 Buena Vista Dr
- 1309 Buena Vista Dr
- 1312 Vista Verde St
- 1308 Vista Verde St
- 1405 Buena Vista Dr
- 1400 Vista Verde St
- 1305 Buena Vista Dr
- 1304 Vista Verde St
- 1312 Buena Vista Dr
- 1400 Buena Vista Dr
- 1308 Buena Vista Dr
- 1404 Vista Verde St
- 1409 Buena Vista Dr
- 1409 Buena Vista Dr
- 1404 Buena Vista Dr
- 1301 Buena Vista Dr
- 1304 Buena Vista Dr
- 1300 Vista Verde St
- 1309 Vista Verde St
- 1305 Vista Verde St