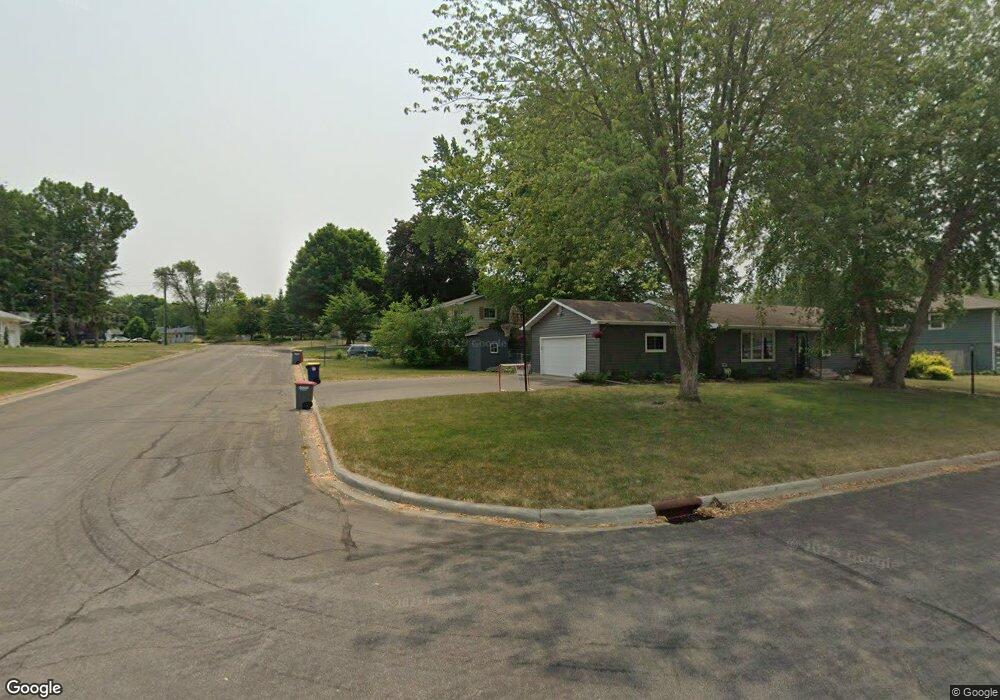
1315 10th St SW Faribault, MN 55021
Estimated Value: $270,000 - $296,000
3
Beds
2
Baths
2,096
Sq Ft
$134/Sq Ft
Est. Value
About This Home
This home is located at 1315 10th St SW, Faribault, MN 55021 and is currently estimated at $280,319, approximately $133 per square foot. 1315 10th St SW is a home located in Rice County with nearby schools including Jefferson Elementary School, Faribault Middle School, and Faribault Senior High School.
Ownership History
Date
Name
Owned For
Owner Type
Purchase Details
Closed on
Jun 17, 2019
Sold by
Tuma Brett W
Bought by
Larson Phalshie M
Current Estimated Value
Home Financials for this Owner
Home Financials are based on the most recent Mortgage that was taken out on this home.
Original Mortgage
$189,504
Outstanding Balance
$166,274
Interest Rate
4.1%
Mortgage Type
FHA
Estimated Equity
$114,045
Purchase Details
Closed on
Jul 10, 2015
Sold by
Mathews Andrew Andrew
Bought by
Tuma Brett Brett
Home Financials for this Owner
Home Financials are based on the most recent Mortgage that was taken out on this home.
Original Mortgage
$156,500
Interest Rate
4.04%
Purchase Details
Closed on
Sep 13, 2002
Sold by
Hanson James Duane and Hanson Dorothy A
Bought by
Mathews Andrew S
Create a Home Valuation Report for This Property
The Home Valuation Report is an in-depth analysis detailing your home's value as well as a comparison with similar homes in the area
Home Values in the Area
Average Home Value in this Area
Purchase History
| Date | Buyer | Sale Price | Title Company |
|---|---|---|---|
| Larson Phalshie M | $193,000 | Edina Realty Title Inc | |
| Tuma Brett Brett | $156,500 | -- | |
| Mathews Andrew S | $159,000 | -- |
Source: Public Records
Mortgage History
| Date | Status | Borrower | Loan Amount |
|---|---|---|---|
| Open | Larson Phalshie M | $189,504 | |
| Previous Owner | Tuma Brett Brett | $156,500 |
Source: Public Records
Tax History Compared to Growth
Tax History
| Year | Tax Paid | Tax Assessment Tax Assessment Total Assessment is a certain percentage of the fair market value that is determined by local assessors to be the total taxable value of land and additions on the property. | Land | Improvement |
|---|---|---|---|---|
| 2025 | $2,700 | $248,200 | $67,600 | $180,600 |
| 2024 | $2,700 | $228,100 | $61,800 | $166,300 |
| 2023 | $2,326 | $228,100 | $61,800 | $166,300 |
| 2022 | $2,046 | $205,000 | $61,800 | $143,200 |
| 2021 | $1,976 | $173,300 | $50,300 | $123,000 |
| 2020 | $1,610 | $148,800 | $44,500 | $104,300 |
| 2019 | $1,494 | $143,600 | $42,500 | $101,100 |
| 2018 | $1,432 | $134,100 | $38,700 | $95,400 |
| 2017 | $1,692 | $127,100 | $36,700 | $90,400 |
| 2016 | $1,378 | $120,000 | $34,800 | $85,200 |
| 2015 | $1,314 | $118,000 | $34,800 | $83,200 |
| 2014 | -- | $118,000 | $34,800 | $83,200 |
Source: Public Records
Map
Nearby Homes
- 1426 Eden Ln
- 1221 Home Place
- 856 Valley View Rd
- 821 Valley View Rd
- 412 Prairie Ave SW
- 1124 8th Ave SW
- 1022 3rd St SW
- 21126 Bagley Ave
- 453 11th St SW
- 1285 Cuylle Bay
- 635 5th Ave SW
- 1705 Vale Ct
- 511 4th Ave SW
- 1425 4th St NW
- 945 Rice St
- 716 1st St NW
- 1844 Patricks Bay
- 1365 S Trail Dr
- 1465 S Trail Cir
- 4 5th Ave NW
- 1019 Valley View Rd
- 2 Sherwood Ct
- 1311 10th St SW
- 1311 1311 10th-Street-sw
- 1 Sherwood Ct
- 3 Sherwood Ct
- 1312 10th St SW
- 1314 10th St SW
- 1307 10th St SW
- 1310 10th St SW
- 1014 Valley View Rd
- 1020 Valley View Rd
- 1039 Valley View Rd
- 1411 Eden Ln
- 925 Valley View Rd
- 936 Prairie Ave SW
- 4 Sherwood Ct
- 1026 Valley View Rd
- 6 Sherwood Ct
- 1022 Prairie Ave SW