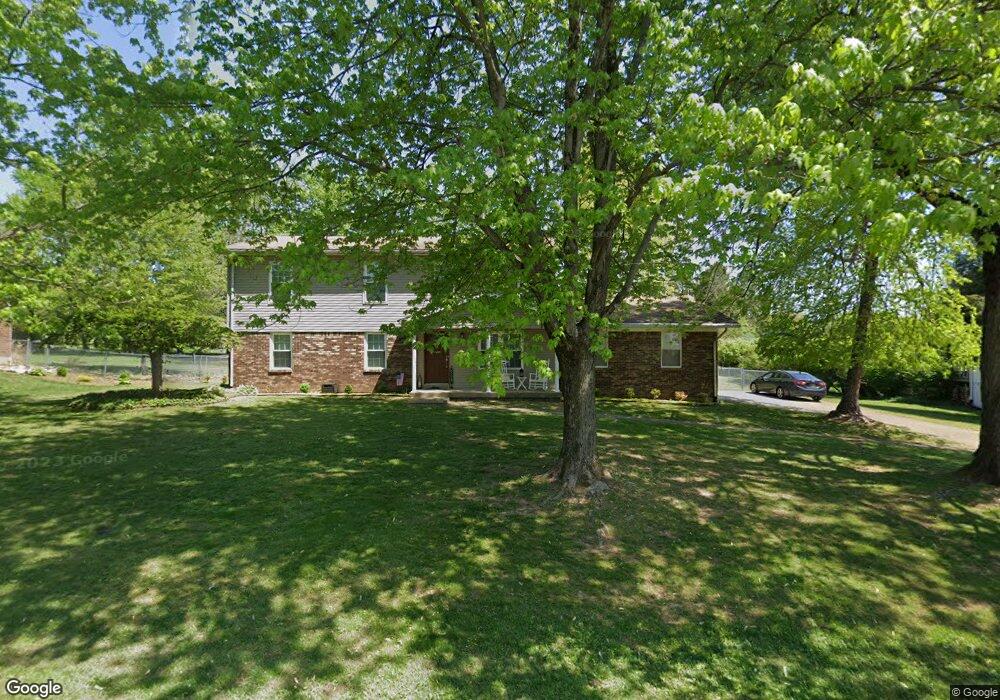
1315 Cedar Dr Georgetown, IN 47122
Estimated Value: $314,000 - $384,000
4
Beds
3
Baths
2,352
Sq Ft
$145/Sq Ft
Est. Value
About This Home
This home is located at 1315 Cedar Dr, Georgetown, IN 47122 and is currently estimated at $339,996, approximately $144 per square foot. 1315 Cedar Dr is a home located in Floyd County with nearby schools including Georgetown Elementary School, Highland Hills Middle School, and Floyd Central High School.
Ownership History
Date
Name
Owned For
Owner Type
Purchase Details
Closed on
Aug 21, 2023
Sold by
Jenney Daniel
Bought by
Kemper Matthew V
Current Estimated Value
Purchase Details
Closed on
Feb 3, 2023
Sold by
Stacy Niacole D and Stacy Chad G
Bought by
Stacy Niacole D
Home Financials for this Owner
Home Financials are based on the most recent Mortgage that was taken out on this home.
Original Mortgage
$79,000
Interest Rate
5.68%
Mortgage Type
New Conventional
Purchase Details
Closed on
May 18, 2010
Sold by
Stacy Chad G and Stacy Cheryl L
Bought by
Stacy Chad G
Purchase Details
Closed on
Apr 2, 2009
Sold by
The Hsbc Bank Usa Na
Bought by
Stacy Chad G and Stacy Chery L
Home Financials for this Owner
Home Financials are based on the most recent Mortgage that was taken out on this home.
Original Mortgage
$122,637
Interest Rate
4.85%
Mortgage Type
FHA
Purchase Details
Closed on
Oct 21, 2008
Sold by
Padua Anthony E
Bought by
Hsbc Bank Usa Na
Create a Home Valuation Report for This Property
The Home Valuation Report is an in-depth analysis detailing your home's value as well as a comparison with similar homes in the area
Home Values in the Area
Average Home Value in this Area
Purchase History
| Date | Buyer | Sale Price | Title Company |
|---|---|---|---|
| Kemper Matthew V | -- | None Listed On Document | |
| Stacy Niacole D | -- | None Listed On Document | |
| Stacy Chad G | -- | None Available | |
| Stacy Chad G | -- | None Available | |
| Hsbc Bank Usa Na | $81,000 | None Available |
Source: Public Records
Mortgage History
| Date | Status | Borrower | Loan Amount |
|---|---|---|---|
| Previous Owner | Stacy Niacole D | $79,000 | |
| Previous Owner | Stacy Chad G | $122,637 |
Source: Public Records
Tax History
| Year | Tax Paid | Tax Assessment Tax Assessment Total Assessment is a certain percentage of the fair market value that is determined by local assessors to be the total taxable value of land and additions on the property. | Land | Improvement |
|---|---|---|---|---|
| 2024 | $1,032 | $140,600 | $22,400 | $118,200 |
| 2023 | $1,092 | $148,100 | $22,400 | $125,700 |
| 2022 | $1,294 | $159,200 | $22,400 | $136,800 |
| 2021 | $1,162 | $147,900 | $22,400 | $125,500 |
| 2020 | $1,198 | $153,900 | $22,400 | $131,500 |
| 2019 | $1,168 | $153,900 | $22,400 | $131,500 |
| 2018 | $1,297 | $164,200 | $22,400 | $141,800 |
| 2017 | $1,276 | $155,600 | $22,400 | $133,200 |
| 2016 | $1,178 | $154,200 | $22,400 | $131,800 |
| 2014 | $1,357 | $153,400 | $22,300 | $131,100 |
| 2013 | -- | $149,300 | $22,400 | $126,900 |
Source: Public Records
Map
Nearby Homes
- 7014 Dylan Cir
- 1034 Brookstone Ct
- 1004 Carter Dr
- 2004 Peach Tree Ln
- 4046 Oakstone Dr
- 8031 Hudson Ln
- 8026 Hudson Ln
- 1032 Oskin Dr Unit 205
- 1034 Oskin Dr Unit 204
- 1036 Oskin Dr Unit 203
- 1038 Oskin Dr Unit 202
- 1040 Oskin Dr Unit 201
- 2022 Brookstone Way
- Finch Bonus Plan at Knob Hill
- Haylyn 48' Plan at Knob Hill
- Model A Plan at Knob Hill
- Anniston Plan at Knob Hill
- Haylyn Plan at Knob Hill
- Maria Plan at Knob Hill
- Samantha Bonus Plan at Knob Hill
Your Personal Tour Guide
Ask me questions while you tour the home.