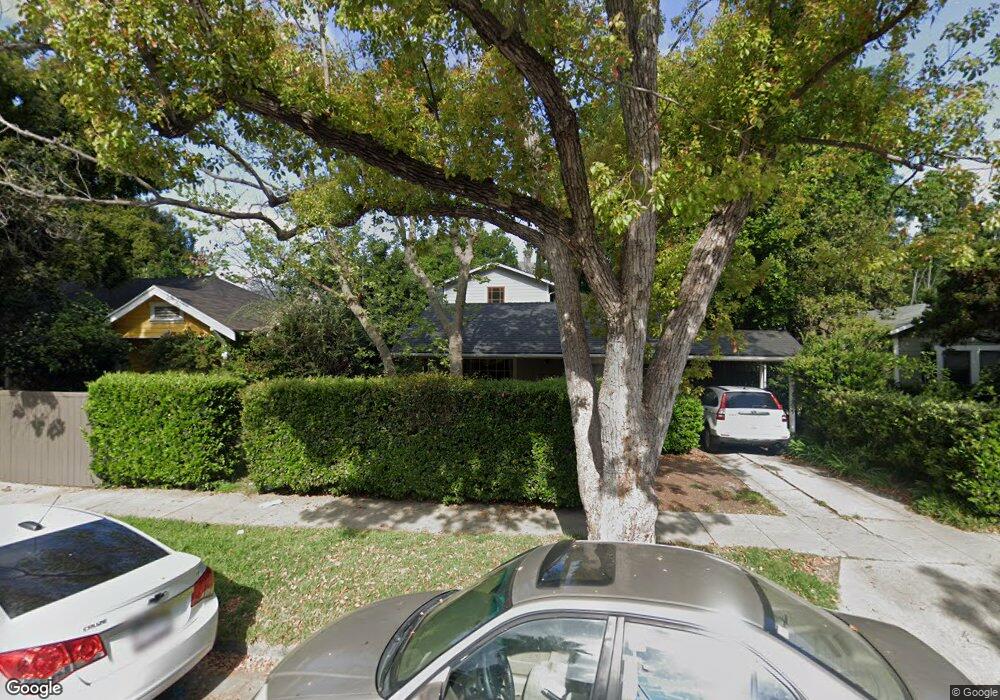
1315 N Occidental Blvd Los Angeles, CA 90026
Estimated Value: $1,371,000 - $1,936,000
3
Beds
2
Baths
1,582
Sq Ft
$1,019/Sq Ft
Est. Value
About This Home
This home is located at 1315 N Occidental Blvd, Los Angeles, CA 90026 and is currently estimated at $1,612,562, approximately $1,019 per square foot. 1315 N Occidental Blvd is a home located in Los Angeles County with nearby schools including Micheltorena Street Elementary School, Thomas Starr King Middle School Film and Media Magnet, and John Marshall Senior High.
Ownership History
Date
Name
Owned For
Owner Type
Purchase Details
Closed on
Dec 3, 2010
Sold by
Zezza Alessandro
Bought by
Zezza Alessandro and Zezza Tonya
Current Estimated Value
Home Financials for this Owner
Home Financials are based on the most recent Mortgage that was taken out on this home.
Original Mortgage
$488,000
Outstanding Balance
$321,755
Interest Rate
4.18%
Mortgage Type
New Conventional
Estimated Equity
$1,290,807
Purchase Details
Closed on
Mar 15, 1999
Sold by
Zezza Tonya
Bought by
Zezza Allessandro
Home Financials for this Owner
Home Financials are based on the most recent Mortgage that was taken out on this home.
Original Mortgage
$175,000
Interest Rate
6.79%
Purchase Details
Closed on
Jun 24, 1995
Sold by
Zezza Tonya A
Bought by
Zezza Alessandro
Purchase Details
Closed on
May 31, 1995
Sold by
Zezza Suzanne G
Bought by
Zezza Carlo F
Create a Home Valuation Report for This Property
The Home Valuation Report is an in-depth analysis detailing your home's value as well as a comparison with similar homes in the area
Home Values in the Area
Average Home Value in this Area
Purchase History
| Date | Buyer | Sale Price | Title Company |
|---|---|---|---|
| Zezza Alessandro | -- | Nations Title Company | |
| Zezza Allessandro | -- | Fidelity National Title Co | |
| Zezza Alessandro | -- | American Coast Title Co Inc | |
| Zezza Carlo F | -- | American Coast Title Co Inc |
Source: Public Records
Mortgage History
| Date | Status | Borrower | Loan Amount |
|---|---|---|---|
| Open | Zezza Alessandro | $488,000 | |
| Previous Owner | Zezza Allessandro | $175,000 | |
| Closed | Zezza Allessandro | $30,000 |
Source: Public Records
Tax History Compared to Growth
Tax History
| Year | Tax Paid | Tax Assessment Tax Assessment Total Assessment is a certain percentage of the fair market value that is determined by local assessors to be the total taxable value of land and additions on the property. | Land | Improvement |
|---|---|---|---|---|
| 2025 | $4,434 | $359,560 | $244,384 | $115,176 |
| 2024 | $4,434 | $352,511 | $239,593 | $112,918 |
| 2023 | $4,350 | $345,600 | $234,896 | $110,704 |
| 2022 | $4,148 | $338,825 | $230,291 | $108,534 |
| 2021 | $4,091 | $332,182 | $225,776 | $106,406 |
| 2019 | $3,969 | $322,330 | $219,080 | $103,250 |
| 2018 | $3,963 | $316,011 | $214,785 | $101,226 |
| 2017 | $3,876 | $309,816 | $210,574 | $99,242 |
| 2016 | $3,776 | $303,743 | $206,446 | $97,297 |
| 2015 | $3,722 | $299,181 | $203,345 | $95,836 |
| 2014 | $3,742 | $293,321 | $199,362 | $93,959 |
Source: Public Records
Map
Nearby Homes
- 1310 N Occidental Blvd
- 1315 Silver Lake Blvd
- 1355 N Benton Way
- 860 N Occidental Blvd
- 1431 Silver Lake Blvd
- 921 N Benton Way
- 957 N Vendome St
- 1474 Westerly Terrace
- 2506 W Sunset Blvd
- 3201 Hamilton Way
- 1506 N Benton Way
- 851 N Rampart Blvd
- 727 N La Fayette Park Place
- 1114 Coronado Terrace
- 444 N Coronado St
- 1531 Silver Lake Blvd
- 802 N Dillon St
- 706 N Occidental Blvd
- 3234 Larissa Dr
- 3110 Berkeley Cir
- 1319 N Occidental Blvd
- 1307 N Occidental Blvd
- 1325 N Occidental Blvd
- 2901 Reservoir St
- 1316 Silver Lake Blvd
- 2917 Reservoir St
- 2913 Reservoir St
- 1318 Silver Lake
- 1318 Silver Lake Blvd
- 2911 Reservoir St
- 2905 Reservoir St
- 1329 N Occidental Blvd
- 1310 Silver Lake
- 1324 Silver Lake Blvd
- 1310 Silver Lake Blvd
- 1308 Silver Lake Blvd
- 1304 1/2 N Occidental Blvd
- 1316 N Occidental Blvd
- 1312 N Occidental Blvd
- 1308 N Occidental Blvd