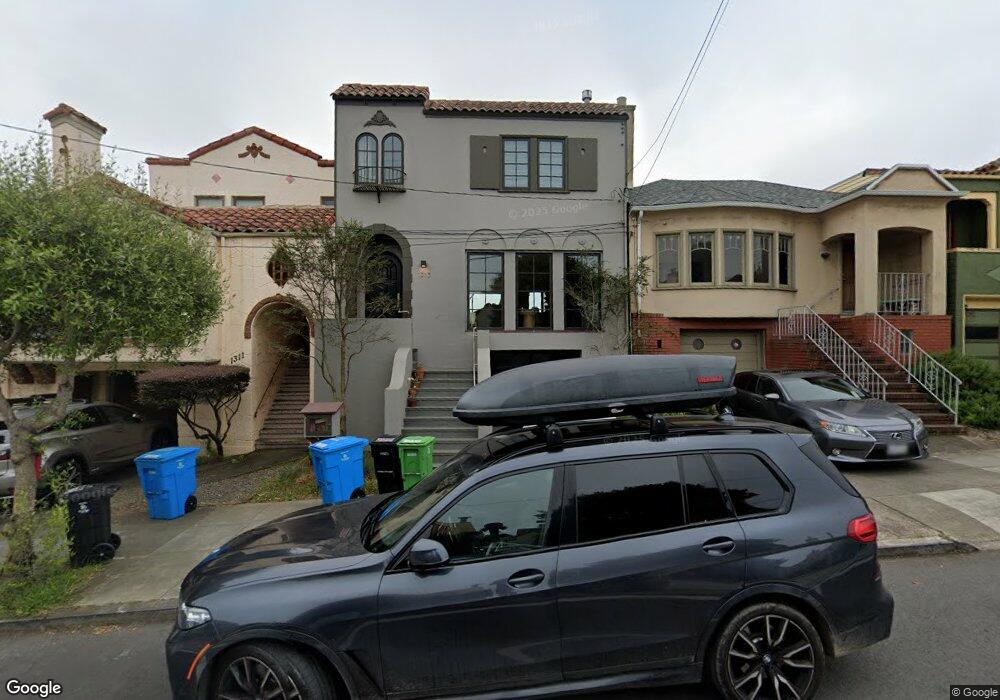
1315 Ulloa St San Francisco, CA 94116
West Portal NeighborhoodEstimated Value: $2,463,000 - $2,968,846
3
Beds
4
Baths
2,630
Sq Ft
$1,044/Sq Ft
Est. Value
About This Home
This home is located at 1315 Ulloa St, San Francisco, CA 94116 and is currently estimated at $2,746,962, approximately $1,044 per square foot. 1315 Ulloa St is a home located in San Francisco County with nearby schools including West Portal Elementary School, Hoover (Herbert) Middle School, and St. Cecilia School.
Ownership History
Date
Name
Owned For
Owner Type
Purchase Details
Closed on
Dec 19, 2017
Sold by
Chivvis Matthew and Lestar Angela
Bought by
Chivvis Matthew and Lestar Angela
Current Estimated Value
Purchase Details
Closed on
May 6, 2016
Sold by
Mark Nelson Development Llc and Richards Brown Darin
Bought by
Chivis Matthew A and Lestar Angela
Home Financials for this Owner
Home Financials are based on the most recent Mortgage that was taken out on this home.
Original Mortgage
$2,099,500
Outstanding Balance
$1,667,526
Interest Rate
3.59%
Mortgage Type
New Conventional
Estimated Equity
$1,079,436
Purchase Details
Closed on
Apr 2, 2014
Sold by
Sanchez William
Bought by
Mark Nelson Development Llc and Darin Richards Brown Revocable Trust
Create a Home Valuation Report for This Property
The Home Valuation Report is an in-depth analysis detailing your home's value as well as a comparison with similar homes in the area
Home Values in the Area
Average Home Value in this Area
Purchase History
| Date | Buyer | Sale Price | Title Company |
|---|---|---|---|
| Chivvis Matthew | -- | None Available | |
| Chivis Matthew A | $2,470,000 | Old Republic Title Company | |
| Mark Nelson Development Llc | -- | Old Republic Title Company |
Source: Public Records
Mortgage History
| Date | Status | Borrower | Loan Amount |
|---|---|---|---|
| Open | Chivis Matthew A | $2,099,500 |
Source: Public Records
Tax History Compared to Growth
Tax History
| Year | Tax Paid | Tax Assessment Tax Assessment Total Assessment is a certain percentage of the fair market value that is determined by local assessors to be the total taxable value of land and additions on the property. | Land | Improvement |
|---|---|---|---|---|
| 2025 | $34,288 | $2,923,972 | $2,046,783 | $877,189 |
| 2024 | $34,288 | $2,866,640 | $2,006,650 | $859,990 |
| 2023 | $33,782 | $2,810,432 | $1,967,304 | $843,128 |
| 2022 | $33,156 | $2,755,327 | $1,928,730 | $826,597 |
| 2021 | $32,573 | $2,701,302 | $1,890,912 | $810,390 |
| 2020 | $32,698 | $2,673,605 | $1,871,524 | $802,081 |
| 2019 | $31,570 | $2,621,182 | $1,834,828 | $786,354 |
| 2018 | $30,504 | $2,569,787 | $1,798,851 | $770,936 |
| 2017 | $29,845 | $2,519,400 | $1,763,580 | $755,820 |
| 2016 | $6,432 | $512,178 | $344,312 | $167,866 |
| 2015 | $6,311 | $504,488 | $339,142 | $165,346 |
| 2014 | $2,929 | $211,005 | $72,442 | $138,563 |
Source: Public Records
Map
Nearby Homes
- 160 Wawona St
- 325 Wawona St
- 270 Claremont Blvd
- 634-636 Taraval St
- 2475 18th Ave
- 8 San Lorenzo Way
- 2292 16th Ave
- 44 Yerba Buena Ave
- 2434 20th Ave
- 2418 20th Ave Unit 101
- 353 Rivera St
- 92 San Pablo Ave
- 730 Santiago St
- 130 San Pablo Ave
- 2266 9th Ave
- 111 Edgehill Way
- 2123 Funston Ave
- 2319-2321 21st Ave
- 95 Junipero Serra Blvd
- 129 Edgehill Way